Compiled by: Leonellha Barreto Dillon, seecon international gmbh
Based on inputs from: Francesco Fatone, Anna Laura Eusebi, Massimiliano Sgroi, Federica Simonetti, Nicolò Ciuccoli and Ali Hydar, WWEELab research Group, Università Politecnica delle Marche – Dipartimento di Scienze e Ingegneria della Materia, dell’Ambiente ed Urbanistica
Tool 4. Decision support system (DSS) based on health and environmental risk
The Decision Support System (DSS) based on health and environmental risk is a software tool for identifying and assessing risks at each point of discharge within a sewer system that collects urban water runoff (UWR). It is designed to support the evaluation of potential discharge and reuse scenarios, as well as the suitability of corresponding treatment solutions.
The tool combines stormwater management model based runoff modelling, quantitative risk assessment and GIS-based visualization to translate water quality data into practical decision support. It applies Quantitative Microbial Risk Assessment (QMRA) to evaluate health risks related to pathogens (NRMMC–EPHC–AHMC, 2009), and Quantitative Chemical Risk Assessment (QCRA) to assess environmental risks related to chemical contaminants. In addition, it includes an Early Warning System (EWS) to alert users when critical precipitation events may require restrictions on runoff reuse or management.
The tool helps municipalities, utilities and regulators understand where urban runoff becomes a risk for human health or the environment, prioritize critical discharge points, and compare management options based on risk rather than concentration alone. It supports more targeted decisions on reuse, discharge, treatment and the implementation of Water Sensitive Urban Design (WSUD) measures.
Key outputs include:
- GIS-based risk maps showing environmental and human health risks at different discharge points within the sewer network.
- QMRA outputs for runoff reuse scenarios, including risk indicators for pathogens such as E. coli (indicator organism), Rotavirus, Campylobacter, and Cryptosporidium.
- QCRA outputs for runoff discharge scenarios, including risk indicators for chemical contaminants such as heavy metals and hydrocarbons.
- Risk assessment results for the following heavy metals: Cadmium (Cd), Chromium (Cr), Copper (Cu), Mercury (Hg), Nickel (Ni), Lead (Pb), Zinc (Zn), Cobalt (Co), Iron (Fe), Aluminum (Al), and Manganese (Mn).
- Risk assessment results for the following hydrocarbons: Anthracene, Phenanthrene, Naphthalene, and Benzopyrene.
- Scenario-based comparison of discharge, reuse and treatment options, including reuse for toilet flushing, municipal irrigation, firefighting, washing machine use, and garden irrigation, as well as discharge into surface water or sea water.
- Early warning outputs indicating when critical rainfall conditions may require restrictions on the reuse of harvested urban runoff.
- Support for assessing how green infrastructure and other treatment solutions reduce environmental and health risks in WSUD planning.
How does the tool support the implementation of EU Directive 2024/3019?
EU Directive 2024/3019 requires cities to move towards a risk-based understanding of urban wastewater discharges, including stormwater overflows and urban runoff, and to translate this understanding into Integrated Urban Wastewater Management Plans (IUWMPs). This raises a key practical question for municipalities and utilities: how can risks to human health and the environment be quantified at specific discharge points, and how can these risks be used to decide whether water should be discharged, reused, or further treated?
The risk-based DSS provides a direct answer by enabling quantitative assessment of both microbial and chemical risks associated with urban runoff and sewer overflows. By combining QMRA and QCRA methodologies with hydraulic modelling and GIS-based visualization, the tool allows users to identify where pollution actually becomes a risk, evaluate how this risk changes under different scenarios (e.g., reuse, discharge, treatment), and support safe management decisions. In this way, the tool operationalizes the Directive’s shift from monitoring concentrations to assessing and managing risk.
In concrete terms, the tool is relevant to Article 5, because it supports the risk-based logic of the Integrated Urban Wastewater Management Plan and contributes to the analysis required under Annex V. It is also directly relevant to Article 18, which requires Member States to identify and assess risks caused by urban wastewater discharges to the environment and human health. In addition, it supports Article 15 on reuse by helping identify when harvested runoff may be safely reused, and when restrictions or additional treatment are needed. The tool’s early warning function adds an operational layer by indicating when critical rainfall conditions are likely to make reuse unsafe.
Within the IUWMP process, the strongest linkage is to Stage 1 – Understand Your Situation, especially Section 1.5 “Connecting pollution to receiving water risk”. This is where cities need to move from knowing that pollutants are present to understanding whether a given discharge point threatens bathing waters, receiving waters, or public health. The DSS helps do this by calculating DALYs (Disability Adjusted Life Year, a measure of overall disease burden, expressed as the cumulative number of years lost due to ill-health, disability or early death) (WHO, 2016) for microbial reuse risk and risk quotients for chemical discharge risk, and by displaying the results spatially at the level of nodes and discharge points. It also supports Stage 1.2 “Understand rainfall behaviour” of the IUWMP, because it uses dynamic rainfall-runoff modelling, and Stage 2 - Define Objectives and Priorities of IUWMP, because its outputs help formulate risk-based objectives and priorities for the most critical points in the system. Finally, it supports the selection of nature-based solutions and treatment options based on their effectiveness in reducing risk (Stage 3 – Identify and Plan Measures) and enables the assessment of implemented measures by comparing risk levels before and after intervention (Stage 4 – Assess Measures and Monitor Impact). In practice, this allows cities to move from general planning to evidence-based prioritization, focusing investments where risk reduction is most needed.
The tool is not meant to work alone. It complements the other WATERUN tools along the IUWMP process by adding the risk layer that connects pollution evidence and planning options to their actual consequences for human health and the environment. While the other tools help identify where pollution is generated (Tool 2 CleanCityCover), confirm what is present in the field (Tool 1 Portable Monitoring System), and explore where interventions can be implemented (Tool 3 MUST-B), the risk-based DSS shows which discharge points are truly critical, which reuse options are safe, and whether proposed measures reduce risk to acceptable levels. In practice, its added value is to turn data and scenarios into risk-based decisions, so that IUWMP priorities are based not only on pollutant presence or hydraulic performance, but on the real impacts of those discharges and the effectiveness of the response.
What do you need to apply it
The risk-based DSS is a workflow that combines hydraulic modelling, quantitative risk assessment, and spatial visualization. It is designed to be applied by municipalities, utilities, and environmental agencies with access to modelling and GIS capabilities. It has been tested within the WATERUN project in case study areas such as Santiago de Compostela (Spain) and Aarhus (Denmark), and applied in detail in Cupra Marittima (Italy), where it was used to assess risks related to stormwater reuse and discharge scenarios. Applying the tool in a new city requires setting up this workflow step by step, from system modelling to risk mapping.
In practice, the system is built around three core components, which are applied in sequence:
Hydraulic and water quality modelling (SWMM). The first component is the Storm Water Management Model (SWMM), a free software developed by the United States Environmental Protection Agency (EPA, 2010). The EPA SWMM software along with detailed instruction manuals can be downloaded at the link: https://www.epa.gov/water-research/storm-water-management-model-swmmSWMM. It is used to simulate runoff quantity and pollutant transport in urban drainage systems under different rainfall conditions (single events or long-term simulations). To build and calibrate the model, the following inputs are required:
- Spatial data (coordinates, shapefiles, basin areas and sewer network characteristics).
- Technical infrastructure data (e.g., pump curves and system specifications).
- Rainfall data (ideally at least 10 years of records).
- Water quality data for target pathogens and contaminants.
- Flow measurements for model calibration and validation.
Quantitative risk assessment (Python tool for QMRA and QCRA). The second component is the quantitative risk assessment step, which processes the outputs of the SWMM model to evaluate risks to human health and the environment. This step is based on computational routines (developed in Python within the WATERUN project, see Figure 1) that use simulated concentrations and flow data from SWMM as input. To apply this component in practice, users need:
- Time series outputs from the calibrated SWMM model, including pollutant concentrations and flow rates at relevant discharge points.
- Definition of target contaminants and pathogens to be assessed (e.g., E. coli as indicator organism, Campylobacter, Rotavirus, Cryptosporidium, heavy metals and hydrocarbons).
- Selection of relevant exposure scenarios for stormwater reuse (e.g., irrigation, toilet flushing or firefighting) or discharge scenarios to receiving waters.
- Reference parameters and guideline values required for risk calculations, including health-based targets (e.g., DALYs thresholds according to WHO guidelines) for microbial risk assessment (QMRA) and environmental thresholds (e.g., PNEC values – Predicted No-Effect Concentration) and regulatory guidance (EU Technical Guidance Document) for chemical risk assessment (QCRA).
- Definition of exposure assumptions (e.g., frequency of contact, volumes of water exposure), based on standard guidelines such as WHO (2016) and Australian water recycling guidelines (NRMMC-EPHC-AHMC, 2006).
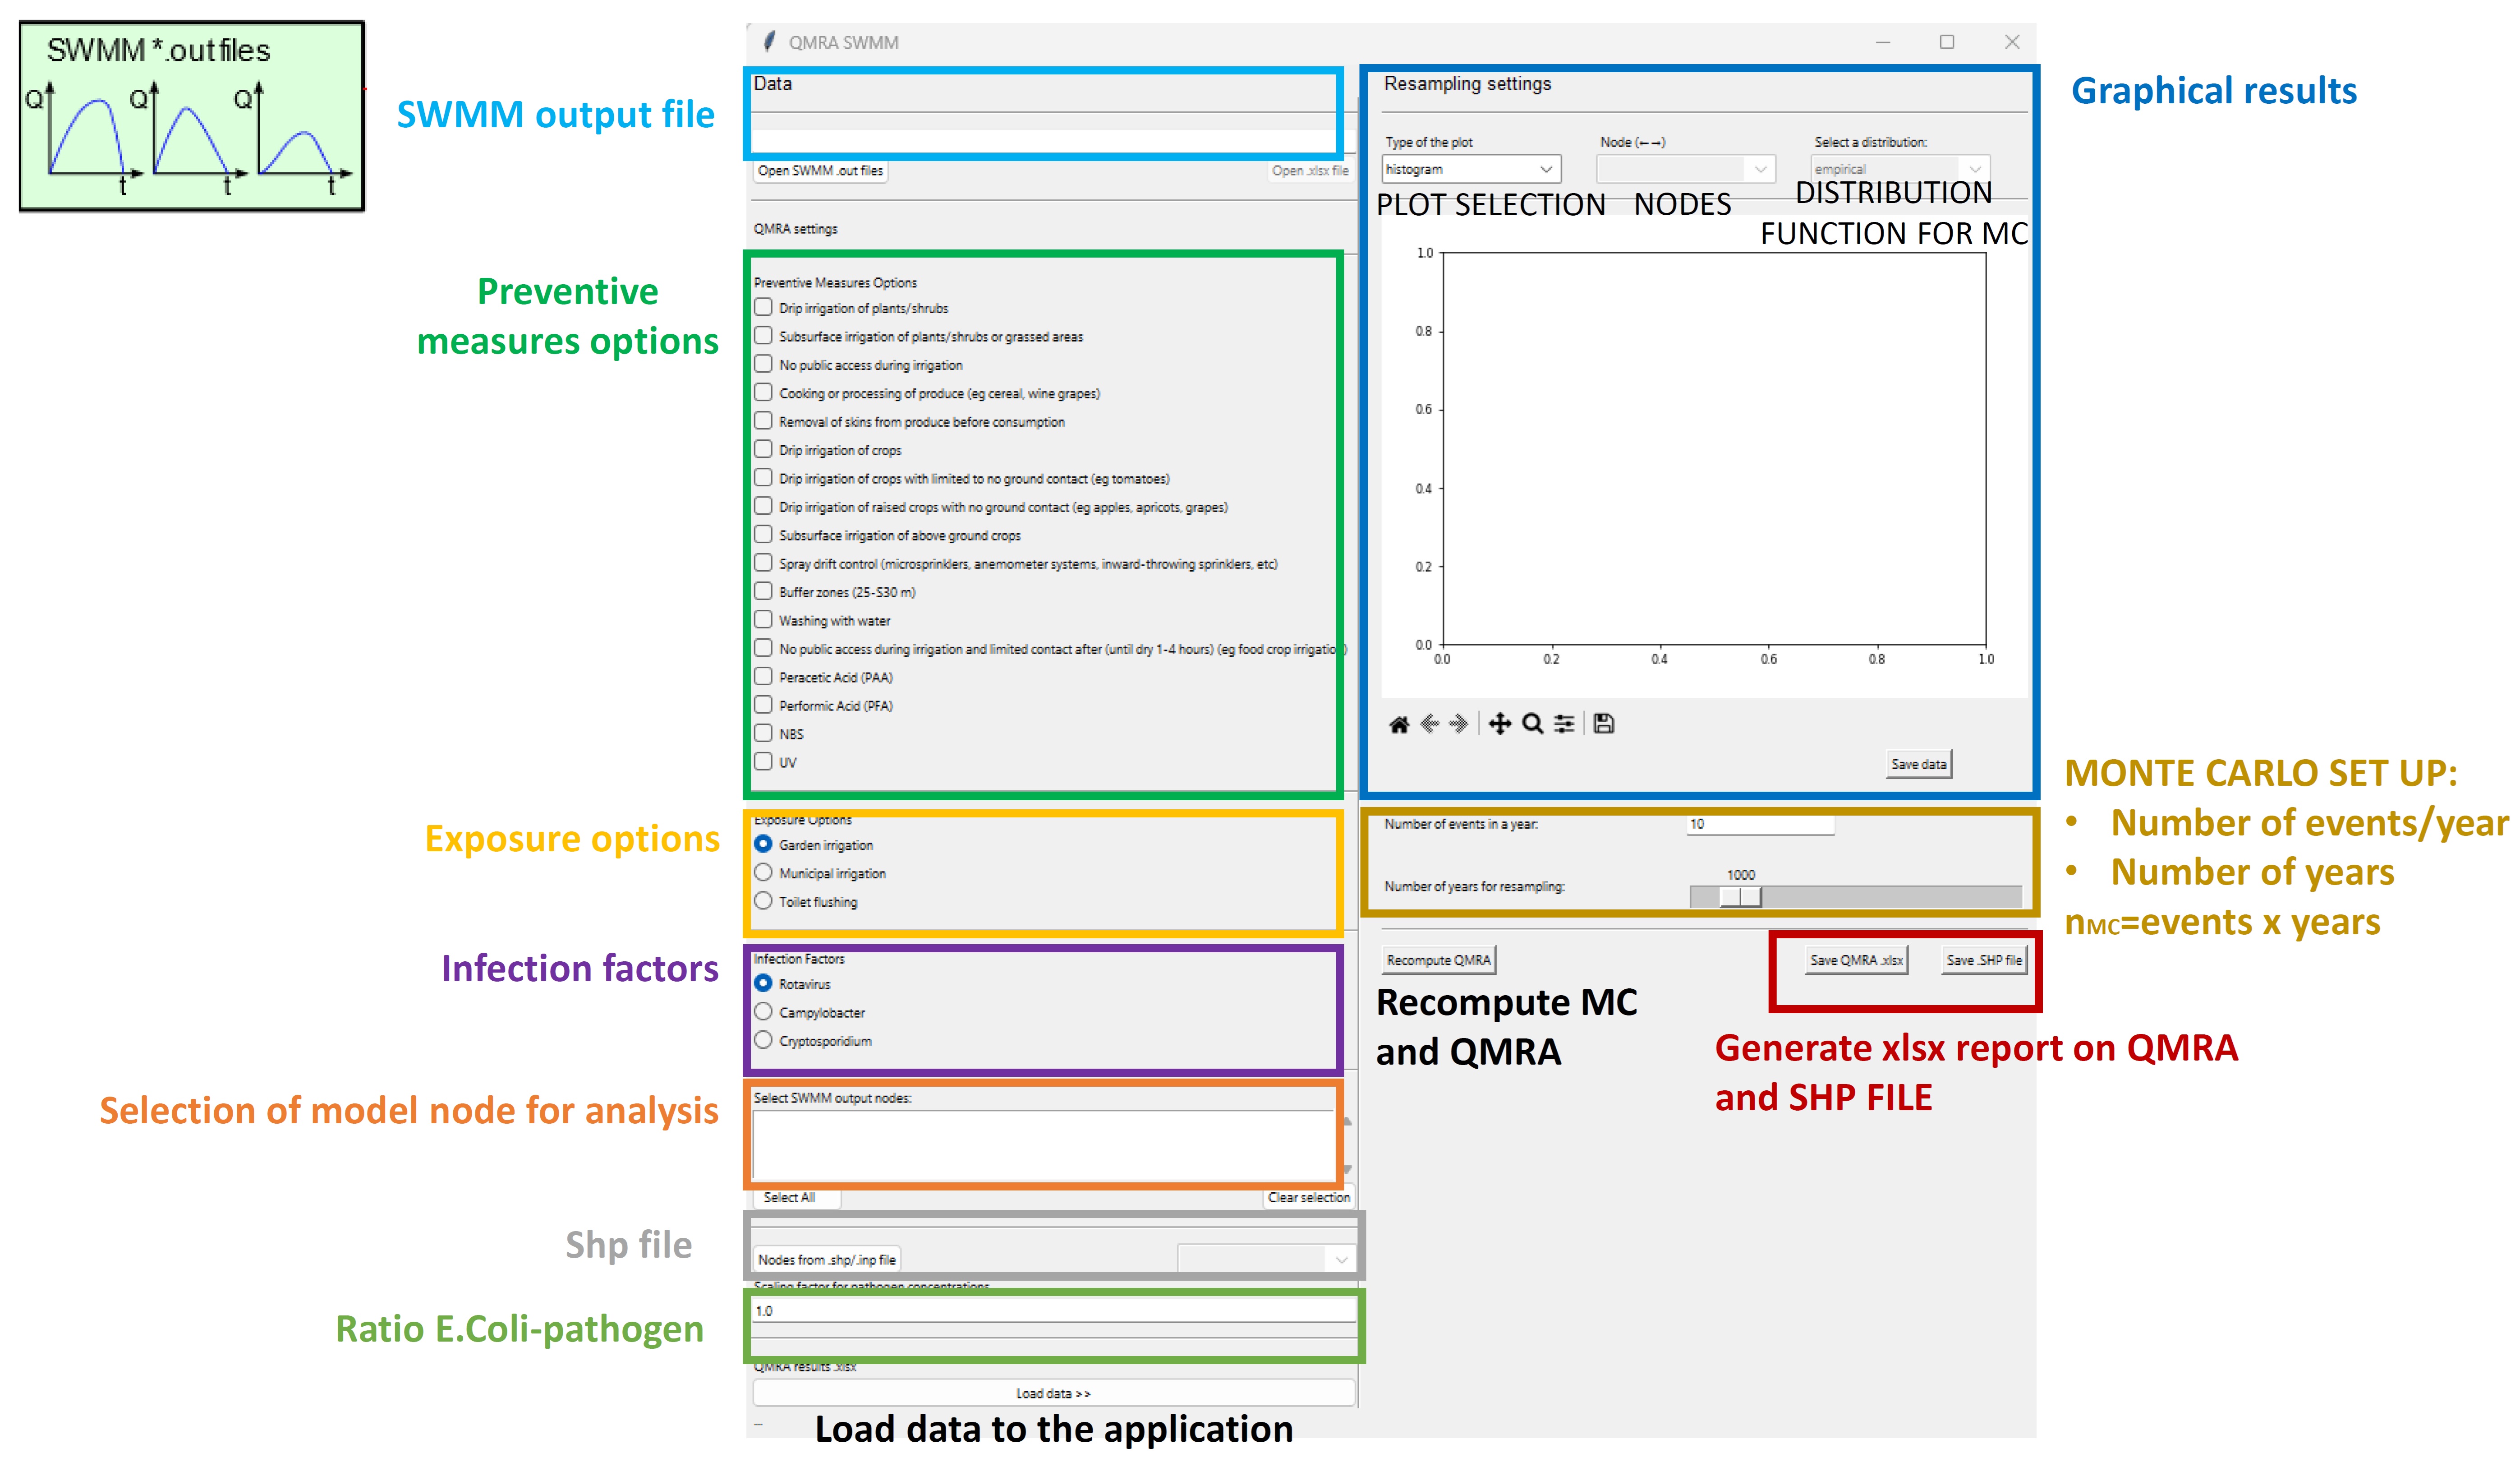
Figure 1. Development of QMRA Tool calculation in Phyton and Graphical User Interface with SWMM. Source: UNIVPM (2024)
This step does not require developing new models from scratch, but it does require the ability to process SWMM outputs and apply established risk assessment frameworks (QMRA and QCRA).
Spatial visualization and decision support (GIS platform). The third component is the visualization and interpretation of results using a Geographic Information System (GIS), which can be downloaded for free at https://qgis.org/. This step translates the outputs of the risk assessment into spatial information that can support decision-making at the level of the sewer network and discharge points (see Figure 2). To apply this component, users need:
- A GIS environment (e.g., QGIS or equivalent open-source software) capable of handling geospatial data layers and shapefiles.
- A georeferenced representation of the sewer network and its nodes (e.g., discharge points, overflow structures), consistent with the SWMM model structure.
- Output data from the risk assessment step (e.g., risk indicators such as DALYs for pathogens or risk quotient (RQ) for chemical contaminants), linked to specific nodes or locations in the network.
- The ability to convert model outputs into spatial formats (e.g., shapefiles or attribute tables) that can be visualized in GIS.
- Definition of scenarios to be compared (e.g., baseline conditions, different treatment options, reuse vs discharge alternatives), allowing users to assess how risk levels change spatially.
Within the GIS environment, results can be visualized as maps highlighting critical discharge points, areas with unacceptable risk levels, and the potential impact of different management or treatment options. This enables comparison between scenarios and supports communication of results across stakeholders involved in urban water management.
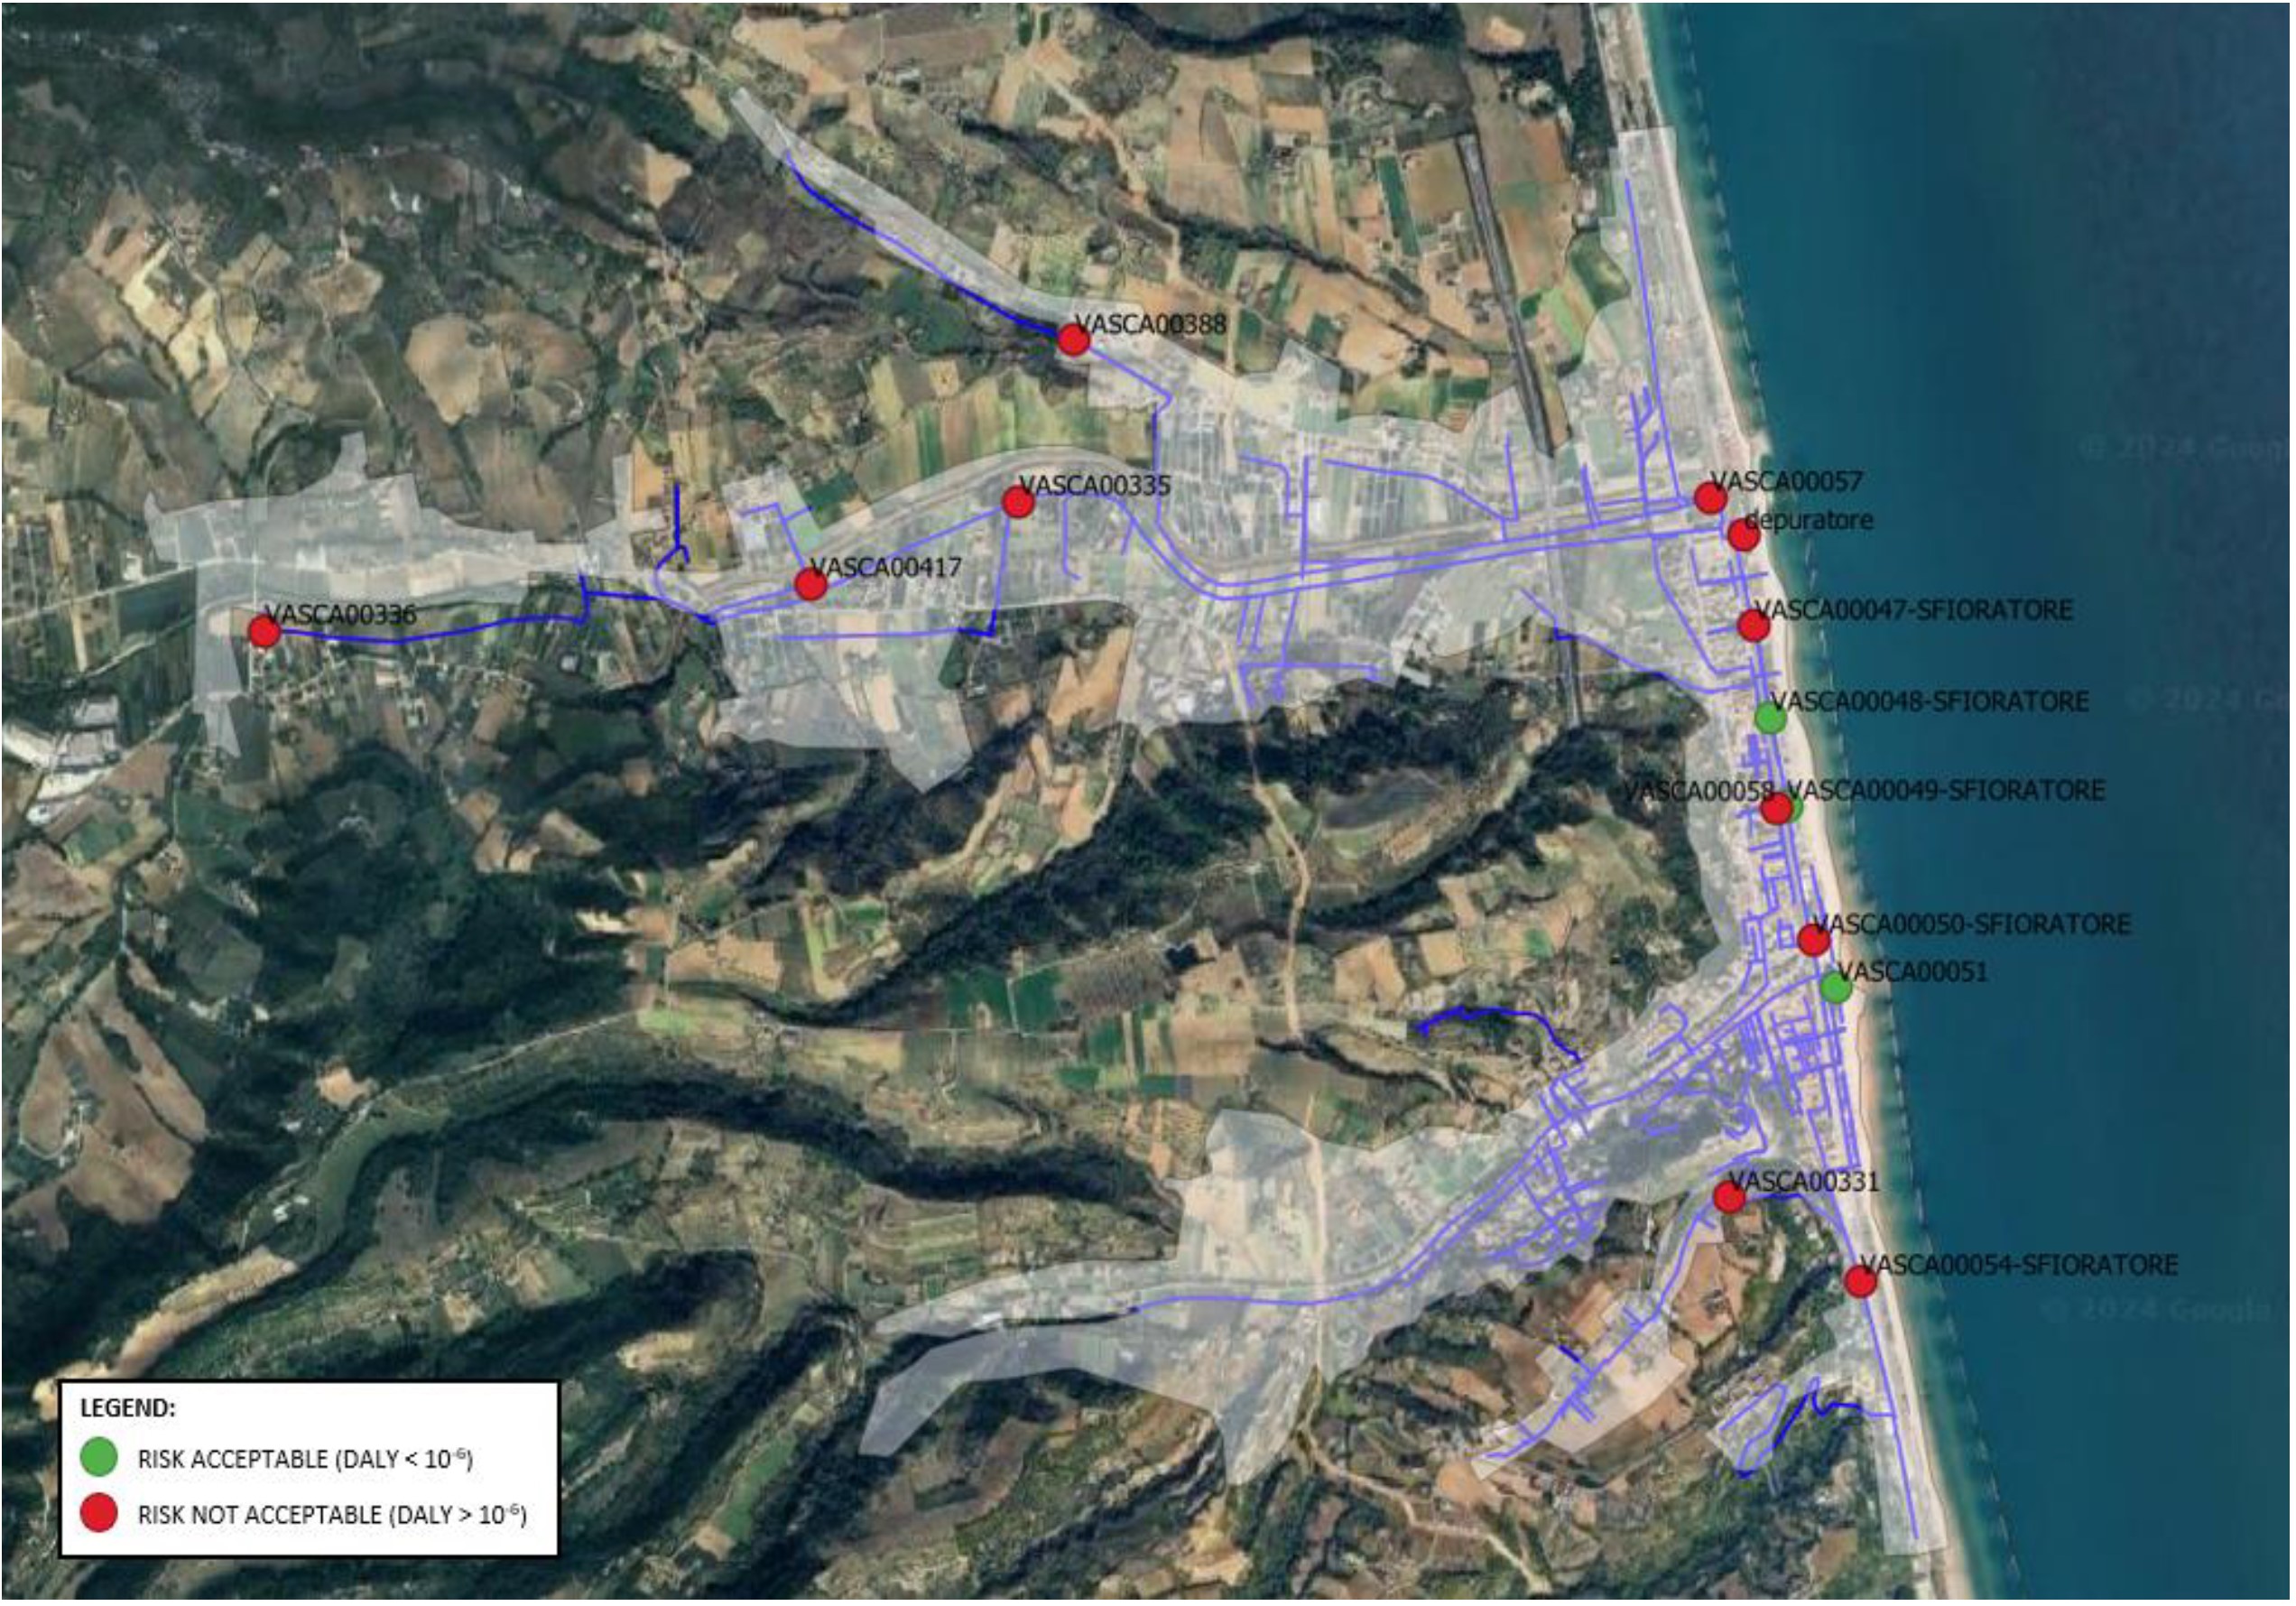
Figure 2. Visualization of the critical discharge points in GIS. Source: UNIVPM (2024)
Overall, applying the DSS requires trained technical staff, particularly for the setup and calibration of the SWMM model and the interpretation of risk assessment results. While the software components are open and accessible, the tool relies on the integration of modelling, data analysis, and GIS, making it most suitable for municipalities or utilities with modelling capacity or access to external expertise.
Cost
The Risk-based DSS relies on open-source software components (e.g., SWMM and QGIS), which are free to download and use. As such, there are no licensing costs associated with the tool itself. However, implementation in a new city requires investment in data collection, model development, and technical capacity.
The main initial cost relates to the development and calibration of the SWMM model, which requires site-specific data. This includes spatial data, rainfall records, and, most importantly, field measurements of pollutant concentrations and flow rates. Sampling campaigns are essential to quantify pathogens and chemical contaminants at key nodes of the sewer network. As a general indication, at least 10 sampling events can be considered a minimum starting point, although the required number depends on the size and complexity of the system. Additional campaigns may be needed to improve model reliability, and periodic re-sampling (e.g., every two years) is recommended to maintain calibration under changing environmental conditions.
Operational costs are primarily related to:
- Field monitoring, including sampling and laboratory analysis of target contaminants (e.g., pathogens, heavy metals, hydrocarbons) at selected locations.
- Flow measurements at sampling points under both wet and dry weather conditions (see Figure 3).
- Personnel time, particularly for trained staff capable of setting up and running SWMM models, processing outputs for risk assessment, and working with GIS tools.
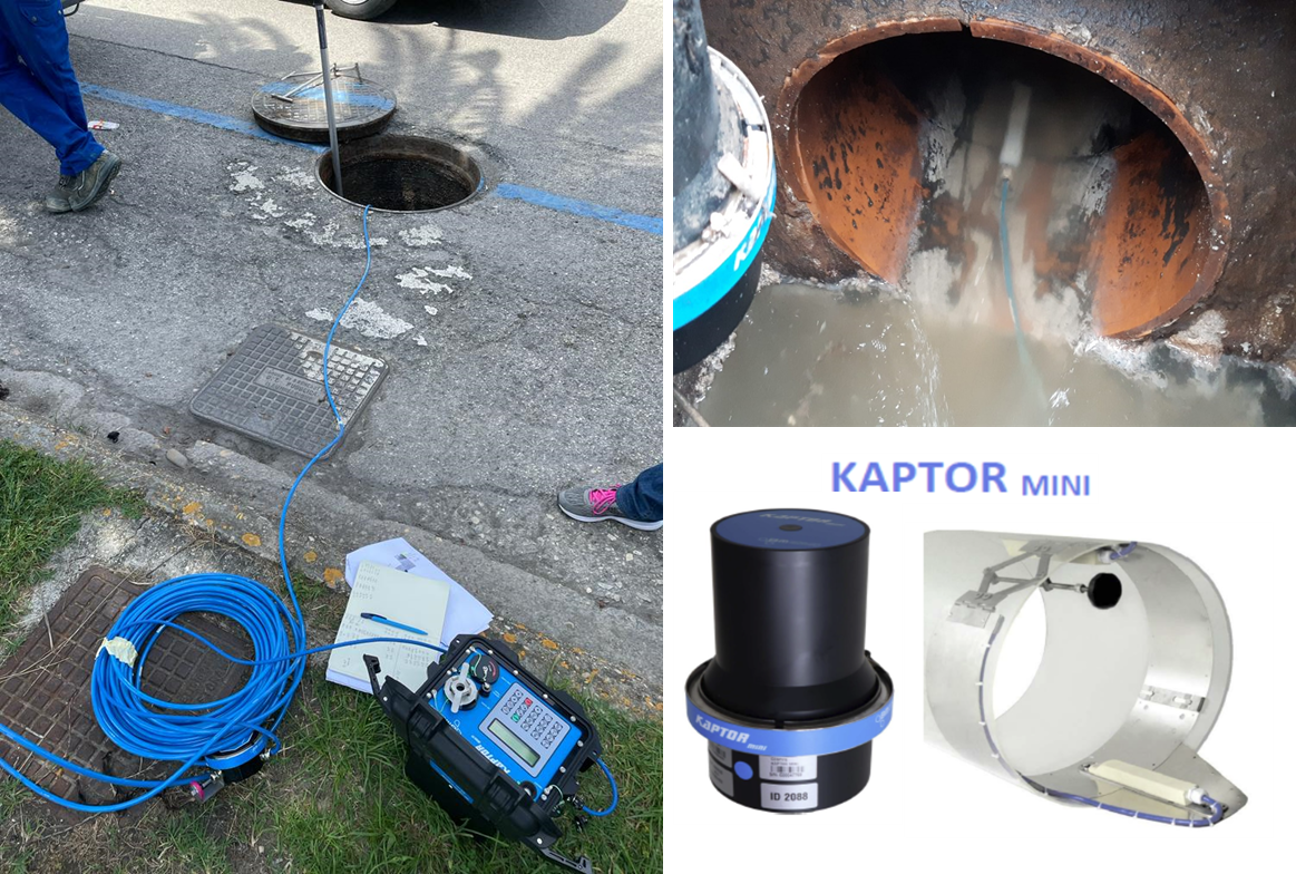
Figure 3. Equipment used for the field monitoring to measure quantity and quality of runoff. Source: UNIVPM (2024)
Unlike simpler screening tools, the DSS requires a higher level of technical expertise and data availability. However, once the system is set up and calibrated, recurring costs are mainly limited to periodic monitoring and staff time for scenario analysis and interpretation of results.
Limitations / Scope
The risk-based DSS is designed to support decision-making for stormwater management by linking modelling outputs with quantitative risk assessment. It does not replace detailed laboratory analysis or regulatory monitoring, but rather complements them by enabling scenario analysis, prioritization of critical discharge points, and comparison of reuse and treatment options.
The approach focuses on translating simulated concentrations of pathogens and contaminants into risk indicators using established frameworks such as QMRA and QCRA. As a result, the tool does not directly measure water quality, but relies on modelled data (e.g., SWMM outputs) combined with available field data for calibration. This means that results depend on the quality, availability, and representativeness of input data, as well as on modelling assumptions. For example, pathogen concentrations may be derived from indicator organisms such as E. coli, which introduces a level of approximation when site-specific measurements are not available.
The risk assessment itself is based on standardized exposure scenarios and internationally recognized guidelines (e.g., WHO and Australian frameworks). While this ensures consistency and comparability, local conditions such as user behavior, climate variability, and infrastructure characteristics may influence actual risk levels. For this reason, results should be interpreted as robust, decision-oriented estimates suitable for planning and prioritization, rather than exact predictions.
In terms of scope, the current implementation covers a defined set of pathogens, heavy metals, and hydrocarbons, and evaluates risks for selected reuse and discharge scenarios. It does not yet fully address emerging pollutants or all possible environmental interactions, and therefore represents a targeted—but not exhaustive—risk assessment framework.
The Early Warning System (EWS) component provides alerts based on rainfall-driven events and expected pollutant loads. It is particularly effective for anticipating risks linked to storm events, but it is not designed to detect all types of contamination (e.g., accidental or non-weather-related pollution events).
Overall, the DSS provides a reliable and practical framework to support urban water management decisions, particularly for identifying priority risks and evaluating mitigation options. Its results are sufficiently robust for planning and strategic use, while benefiting from continuous improvement as more local data and additional parameters are incorporated.
User Guide – How to Use the Tool in Practice
Applying the risk-based DSS in a new city starts with building the modelling and risk-assessment workflow from local data. The process links sewer system modelling, quantitative risk assessment, and GIS-based visualization. Once the necessary data are available, follow these steps:
Step 1 - Define the study area and collect the input data
Identify the drainage basin, sewer network, discharge points, pumping stations, and relevant receiving waters. Gather the spatial, technical, rainfall, flow, and water quality data needed to build and calibrate the SWMM model.
Step 2 - Build the SWMM model of the sewer network
Set up the sewer system in SWMM, including sub-catchments, pipes, junctions, pumping stations, and overflow structures. Configure the model so it can simulate both runoff quantity and pollutant transport under dry and wet weather conditions.
Step 3 - Calibrate and validate the SWMM model
Use measured flow rates and water quality data from selected points in the network to calibrate the model. Check that simulated flows and pollutant concentrations are consistent with observed data before using the model for risk assessment.
Step 4 - Simulate rainfall events and generate runoff-quality outputs
Run the calibrated model for representative rainfall events or longer rainfall series. Extract the simulated concentrations and flow data at relevant nodes and discharge points, since these outputs will be used as input for the risk calculations.
Step 5 - Define hazards, parameters and assessment scenarios
Based on local conditions and available data, define the hazards to be included in the assessment. These typically include microbial hazards (e.g., E. coli as indicator organism and pathogens such as Campylobacter, Rotavirus and Cryptosporidium) and chemical contaminants (e.g., heavy metals and hydrocarbons such as Polycyclic Aromatic Hydrocarbons (PAHs). If direct pathogen measurements are not available, indicator organisms can be used to estimate pathogen loads.
At the same time, define the management scenarios to be evaluated, such as discharge into receiving waters or reuse options (e.g., irrigation, toilet flushing, firefighting, or other non-potable uses). These scenarios determine how water is used or discharged, and therefore which exposure pathways and risk calculations will be required in the next step.
Step 6 - Perform the quantitative risk assessment using the Python tool
Use the SWMM output data (concentrations and flows) as input to the Python-based risk assessment computational routines developed within the WATERUN Project. The tool performs quantitative risk assessment following four standard steps: hazard identification, hazard characterization, exposure assessment, and risk characterization.
For reuse scenarios, the tool applies Quantitative Microbial Risk Assessment (QMRA), defining exposure pathways (e.g., ingestion, contact) and using dose-response models (e.g., Beta-Poisson) to estimate infection risks for selected pathogens. Results are expressed as Disability-Adjusted Life Years (DALYs) and compared against acceptable thresholds (e.g., 10-6 DALY/person/year) to determine whether reuse is safe.
For discharge scenarios, the tool applies Quantitative Chemical Risk Assessment (QCRA), estimating Predicted Environmental Concentrations (PEC) in receiving waters and comparing them with Predicted No-Effect Concentrations (PNEC) derived from regulatory guidance (EU TGD). The resulting risk quotient (RQ = PEC/PNEC) indicates whether environmental risks are acceptable (RQ < 1) or require mitigation (RQ ≥ 1).
The outputs of this step provide a quantitative basis to assess whether specific discharge or reuse scenarios are acceptable and to identify where treatment or management measures are needed.
Step 7 - Evaluate treatment and mitigation options
Use the tool to assess how different preventive and treatment measures reduce environmental and human health risks. These may include nature-based solutions (NBS) and Water Sensitive Urban Design (WSUD) measures, as well as disinfection or treatment processes such as Peracetic Acid (PAA), Performic Acid (PFA), or UV.
For each selected option, define the expected removal efficiencies (log removal values) for pathogens and/or chemical contaminants. The tool provides default ranges for these removal efficiencies, which can be adapted based on local knowledge or design assumptions. These removal rates are applied to the pollutant concentrations generated by the SWMM model.
The updated concentrations are then reprocessed through the QMRA and QCRA calculations to quantify how risks change after treatment. This allows direct comparison between scenarios and supports the identification of measures that effectively reduce risks to acceptable levels.
Step 8 - Map the results in GIS
Link the calculated risk indicators (e.g., DALYs for health risk and risk quotient for environmental risk) to the georeferenced sewer nodes, storage systems, and discharge points. Use GIS to visualize spatial patterns of risk, distinguishing between acceptable and critical conditions. This spatial representation allows users to identify pollution hotspots, compare scenarios (e.g., reuse vs discharge), and understand how risks evolve under different rainfall conditions or treatment options.
Step 9 - Define warning criteria and implement the Early Warning System (EWS)
If the Early Warning System is included, define site-specific warning criteria based on the relationship between rainfall patterns and pollutant loads. These criteria are derived from local monitoring data and statistical analysis, linking precipitation conditions (e.g., rainfall intensity, duration, and dry periods before events) with expected contamination levels.
The EWS uses a Python-based algorithm that connects to real-time meteorological data sources and processes rainfall information according to predefined thresholds. When these thresholds are exceeded, the system generates alerts indicating conditions under which high pollutant loads are likely to occur and when restrictions on stormwater reuse or discharge may be needed.
Warnings are communicated through a GIS interface, where alarm statuses are visualized directly on the map for specific points of interest. This enables users to anticipate critical events (e.g., first-flush effects after dry periods or low-intensity rainfall associated with higher concentrations) and take preventive action before risks materialize.
Step 10 - Use the results to support decisions and update the system over time
Use the mapped results and risk indicators to prioritize critical discharge points, evaluate the feasibility of reuse scenarios, and compare the effectiveness of treatment and mitigation options. The tool supports both long-term planning (e.g., infrastructure investments, WSUD strategies) and short-term management decisions (e.g., operational restrictions during risk events).
To maintain reliability, update the SWMM model and risk calculations periodically using new monitoring data. This includes recalibrating the model, refining risk parameters, and adjusting EWS thresholds as local conditions evolve.
What Decisions Does the Tool Enable?
The risk-based DSS supports decision-making at strategic, planning, and operational levels by translating complex modelling and risk assessment results into clear, actionable insights for urban water management.
At a strategic level, the tool helps municipalities, utilities, and regulators understand where urban runoff or sewer overflows pose the greatest risk to human health and the environment. By combining hydraulic modelling with quantitative risk assessment, it enables the identification and prioritization of critical discharge points across the sewer network. This supports long-term planning by highlighting where investments are most needed and by distinguishing between situations where runoff can be safely reused and those where additional treatment or restrictions are required.
At a planning level, the tool supports the selection and evaluation of management and treatment options. By simulating different scenarios, including discharge, reuse, and the implementation of treatment solutions such as nature-based systems or disinfection processes, it allows users to assess how risks change under each option. This makes it possible to compare alternatives, eliminate unsuitable solutions early, and design interventions that effectively reduce risks to acceptable levels. It also supports Water Sensitive Urban Design (WSUD) by showing how specific measures contribute to risk reduction at different locations in the system.
At an operational level, the tool supports decision-making under varying environmental conditions. By linking rainfall events to changes in pollutant loads and risk levels, it helps identify when certain reuse practices may become unsafe or when additional precautions are needed. In this context, the Early Warning System component can support short-term decisions by indicating conditions under which stormwater reuse or discharge may need to be restricted due to increased risk.
In practice, the tool enables users to answer the following key questions:
- where are the highest-risk discharge points?
- which management or treatment options are effective?
- which reuse scenarios are safe, and under which conditions actions should be adjusted or avoided?
Case Studies
Aarhus, Denmark — Monitoring-based thresholds and Early Warning System development
In Aarhus, the risk-based DSS was applied in several urban catchments equipped with Sustainable Urban Drainage Systems (SUDS), including wet detention ponds and infiltration systems in residential and industrial areas such as Tulipgrunden, Risvangen, and Lystrup. These sites were instrumented with monitoring devices to collect flow data and water quality samples, enabling the characterization of urban runoff under real conditions.
Field campaigns carried out between 2023 and 2024 generated datasets on macropollutants (e.g., nitrogen compounds, Total Organic Carbon (TOC) and trace metals. The analysis showed that pollutant concentrations were generally low, with many heavy metals below detection limits, and that runoff quality was strongly influenced by rainfall patterns. In particular, lower precipitation events were associated with higher pollutant concentrations, while higher rainfall led to dilution effects.
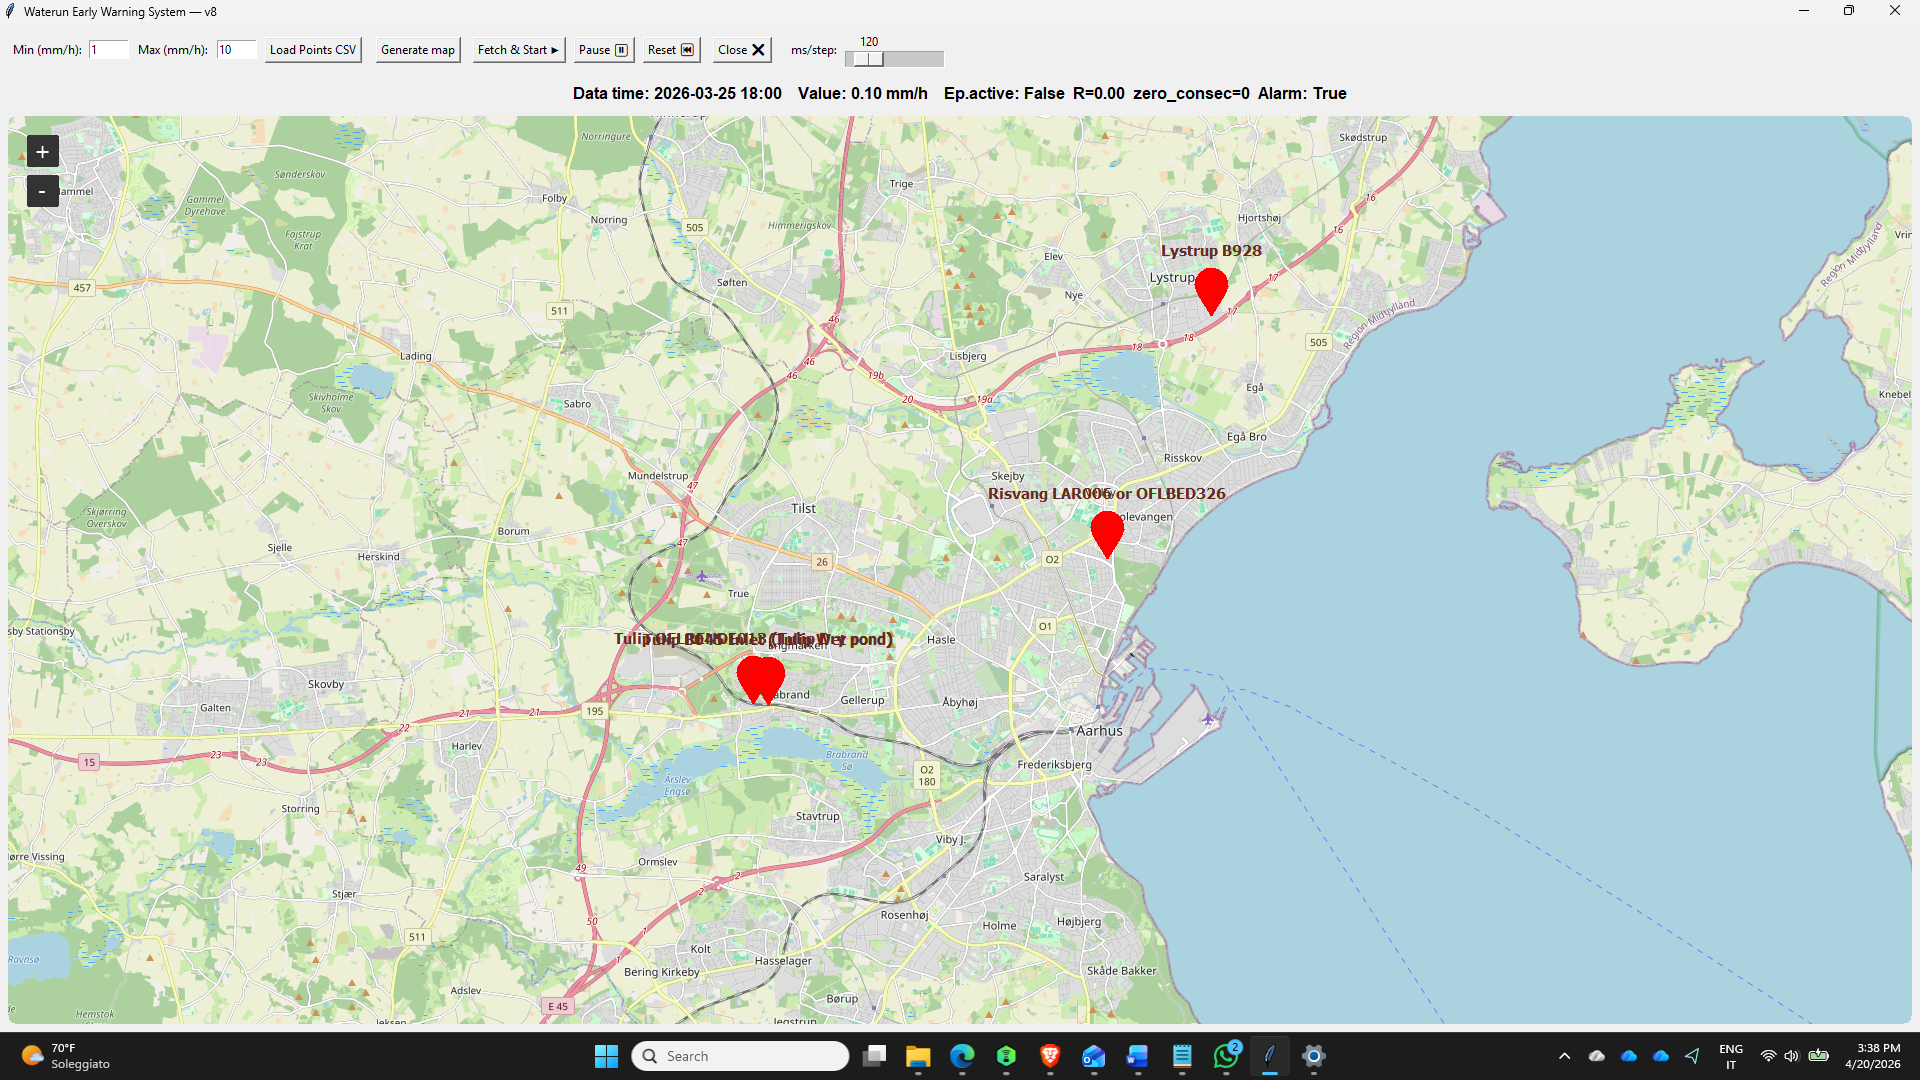
Figure 4. Visualization of temporal and spatial distribution of risk events across urban areas in Aarhus. Source: EWS (n.d.)
These datasets were used to derive site-specific thresholds linking precipitation conditions to expected water quality. This formed the basis for the development of the Early Warning System (EWS), which uses rainfall data to anticipate periods of higher contamination risk (see Figure 4). The Aarhus case therefore contributed primarily to defining the empirical relationships between rainfall and pollutant dynamics, which are essential for triggering warnings and supporting real-time decision-making.
Overall, the application in Aarhus demonstrated how combining monitoring data with statistical analysis can support predictive, risk-informed management of urban runoff, particularly in systems where nature-based solutions are already in place.
Santiago de Compostela, Spain — Site-specific criteria for risk prediction and management
In Santiago de Compostela, the DSS was applied to urban runoff systems where monitoring campaigns provided data on pollutant occurrence and variability under different hydrological conditions. Similar to Aarhus, the focus was on linking observed water quality patterns with rainfall dynamics to support risk-based decision-making.
The collected datasets were used to establish site-specific criteria for the Early Warning System, allowing the identification of conditions under which pollutant loads are expected to increase. These criteria were integrated into a Python-based algorithm capable of processing real-time precipitation data and generating warnings through a GIS interface.
The Santiago case study therefore played a key role in testing how the DSS framework can be adapted to different urban contexts, ensuring that warning thresholds and risk interpretations are tailored to local conditions. It also demonstrated the importance of combining monitoring data with modelling and risk assessment approaches to support safe reuse and management of urban runoff.
Cupra Marittima, Italy — Full integration of modelling and quantitative risk assessment
Compiled from: SZELĄG et al. (2025)
In Cupra Marittima, the risk-based DSS was applied to a coastal combined sewer system to assess risks associated with stormwater discharge and reuse, and to support planning decisions under real operational conditions.
Figure 5. Sewage network catchment in Cupra Marittima. White sewer network is highlighted in green, the black sewer network in purple and the combined network in orange. Source: UNIVPM (2024)
The study area covers a 2.15 km2 catchment with a mixed sewer system, including 13 combined sewer overflow (CSO) points discharging into streams connected to bathing waters. A detailed SWMM model of the network was developed, representing sub-catchments, pipes, pumping stations, and overflow structures (see Figure 6). The model was calibrated and validated using flow measurements and water quality data (E. coli) collected at multiple monitoring points under both dry and wet conditions.
Figure 6. Schematization of the sewer network system of Cupra Marittima with localization of flow meters Kaptor mini, sampling points, CSO and pumping stations. Source: UNIVPM (2024)
Using this calibrated model, 210 rainfall events over a 9-year period were simulated to estimate flow volumes, overflow frequencies, and pathogen concentrations at each CSO. These simulations provided the quantitative basis for risk assessment, allowing the system to move from hydraulic behavior to health and environmental risk evaluation.
The outputs were then used to perform Quantitative Microbial Risk Assessment (QMRA) for different reuse scenarios, including municipal irrigation, garden irrigation, and toilet flushing. Exposure pathways, ingestion volumes, and exposure frequencies were defined according to international guidelines, and dose–response models (Beta-Poisson) were applied to estimate infection probabilities and calculate health risks expressed as DALYs. Monte Carlo simulations were used to account for variability across rainfall events and exposure conditions.
Results showed that risk levels vary significantly depending on both location and reuse scenario. Municipal irrigation presented the highest risk due to higher exposure frequency, while toilet flushing showed the lowest risk. Certain overflow nodes (e.g., N5, N10, N11, N12) were identified as critical due to higher overflow frequency and pathogen concentrations, while others showed consistently lower risk levels.
The DSS was also used to evaluate the effect of treatment measures (see Figure 7). By simulating removal efficiencies for nature-based solutions (NBS), UV disinfection, and performic acid (PFA), the analysis demonstrated that combined treatment strategies can significantly reduce microbial risk. In many cases, treatment allowed risk levels to fall below WHO thresholds (10⁻⁶ DALY/person/year), although some critical nodes remained problematic under specific scenarios.
Figure 7. Outputs of risk-based DSS for the evaluation of the microbial risk (QMRA) associated with the reuse of stormwater produced for CSO for municipal irrigation in the current scenario and after the application of NBS and UV disinfection. Source: UNIVPM (2025)
In parallel, the modelling results supported the identification of overflow points affecting bathing water quality by comparing simulated E. coli concentrations with thresholds from the EU Bathing Water Directive. This enabled the detection of conditions leading to short-term pollution events and informed potential management measures, such as restricting bathing after heavy rainfall.
Overall, the Cupra Marittima case demonstrates the full DSS workflow in practice: from data collection and hydraulic modelling to quantitative risk assessment and scenario evaluation. It shows how the tool can translate complex system dynamics into actionable insights, supporting decisions on where to intervene, which treatment options to prioritize, and under which conditions stormwater reuse can be considered safe.
Contact Information
The risk-based DSS was developed by the WWEELab research Group of the Dipartimento di Scienze e Ingegneria della Materia, dell’Ambiente ed Urbanistica of the Università Politecnica delle Marche, Ancona (Italy)
- Francesco Fatone; email: f.fatone@staff.univpm.it
- Anna Laura Eusebi; email: a.l.eusebi@staff.univpm.it
- Massimiliano Sgroi; email: m.sgroi@staff.univpm.it
- Federica Simonetti; email: f.simonetti@staff.univpm.it
- Nicolò Ciuccoli, email: n.ciuccoli@staff.univpm.it
- Ali Hydar, email: a.hydar@staff.univpm.it
- WWEELab research Group: info@wweelab.it
- Web-site: www.wweelab.it
Directive 2000/60/EC (Water Framework Directive)
Directive 2006/7/EC on Bathing Water Quality
Directive 2008/105/EC on Environmental Quality Standards
Australian Guidelines for Water Recycling: Managing Health and Environmental Risks (Phase 1)
Australian Guidelines for Water Recycling: Managing Health and Environmental Risks (Phase 2) – Stormwater Harvesting and Reuse
Deliverable D5.3. Decision-support framework and mapping tool for water quality and risk analysis provision
Report with the description of the final implementation of the risk-based DSS in the CS of Santiago and Aarhus, including the algorithms for QMRA and QCRA analysis and the display of results in the GIS-based mapping tool for different reuse scenarios.
WATERUN CONSORTIUM (2026): Deliverable D5.3. Decision-support framework and mapping tool for water quality and risk analysis provision. WATERUN Project, EU Horizon Europe Grant Agreement No. 101060922. Document not yet publicly available.Deliverable D5.4: Implementation of EWS for a safe UWR reuse and management
Report describing the development, configuration and complete structure of the Early Warning System, including outcomes of the performed simulations in the case studies of Santiago and Aarhus.
THE WATERUN CONSORTIUM (2022): Deliverable D5.4: Implementation of EWS for a safe UWR reuse and management. In: WATERUN Project, EU Horizon Europe Grant Agreement No. 101060922. Document not yet publicly available :Deliverable D5.5. Risk-based tool for WSUD
Report of the development and validation of the risk-based tool to perform WSUD assisting the selection of the most suitable Green Infrastructure and stormwater treatment process to reduce health and environmental risk.
WATERUN CONSORTIUM (n.d.) Deliverable D5.5. Risk-based tool for WSUD. WATERUN Project, EU Horizon Europe Grant Agreement No. 101112723. Lead Beneficiary: . Document not yet publicly available.Product 4: Decision Support System based on Health and Environmental Risk
WATERUN Project
This is the official webpage of WATERUN, an EU-funded Horizon Europe research project focused on sustainable urban water runoff management. It develops innovative methodologies based on Water-Sensitive Urban Design (WSUD), offering cities both preventive and mitigation solutions for urban water challenges.
WATERUN.EU (2022): https://www.waterun.eu/ [Accessed: 15.04.2026]