Compiled by: Leonellha Barreto Dillon, seecon international gmbh
Based on inputs from: Caoilte O’Rourke O’Cuirrin, Marianna Zolyomiova, Fiona Regan and Mercedes Vázquez, Dublin City University (DCU)
Tool 1. Portable Monitoring System – Rapid Detection of Microplastics and PAHs in Urban Runoff
The Portable Monitoring System is a set of portable sensors and practical sampling procedures for the rapid on-site identification and semi-quantification of microplastics and polycyclic aromatic hydrocarbons (PAHs) in urban runoff.
It combines a colorimetric PAH sensor and a fluorescence-based microplastics sensor with smartphone imaging, allowing users to screen water samples quickly and at low cost without relying on laboratory analysis for every sample.
The tool helps municipalities, utilities and other practitioners identify pollution hotspots early, prioritize where more detailed investigation is needed, and reduce the time and cost of runoff pollution assessment.
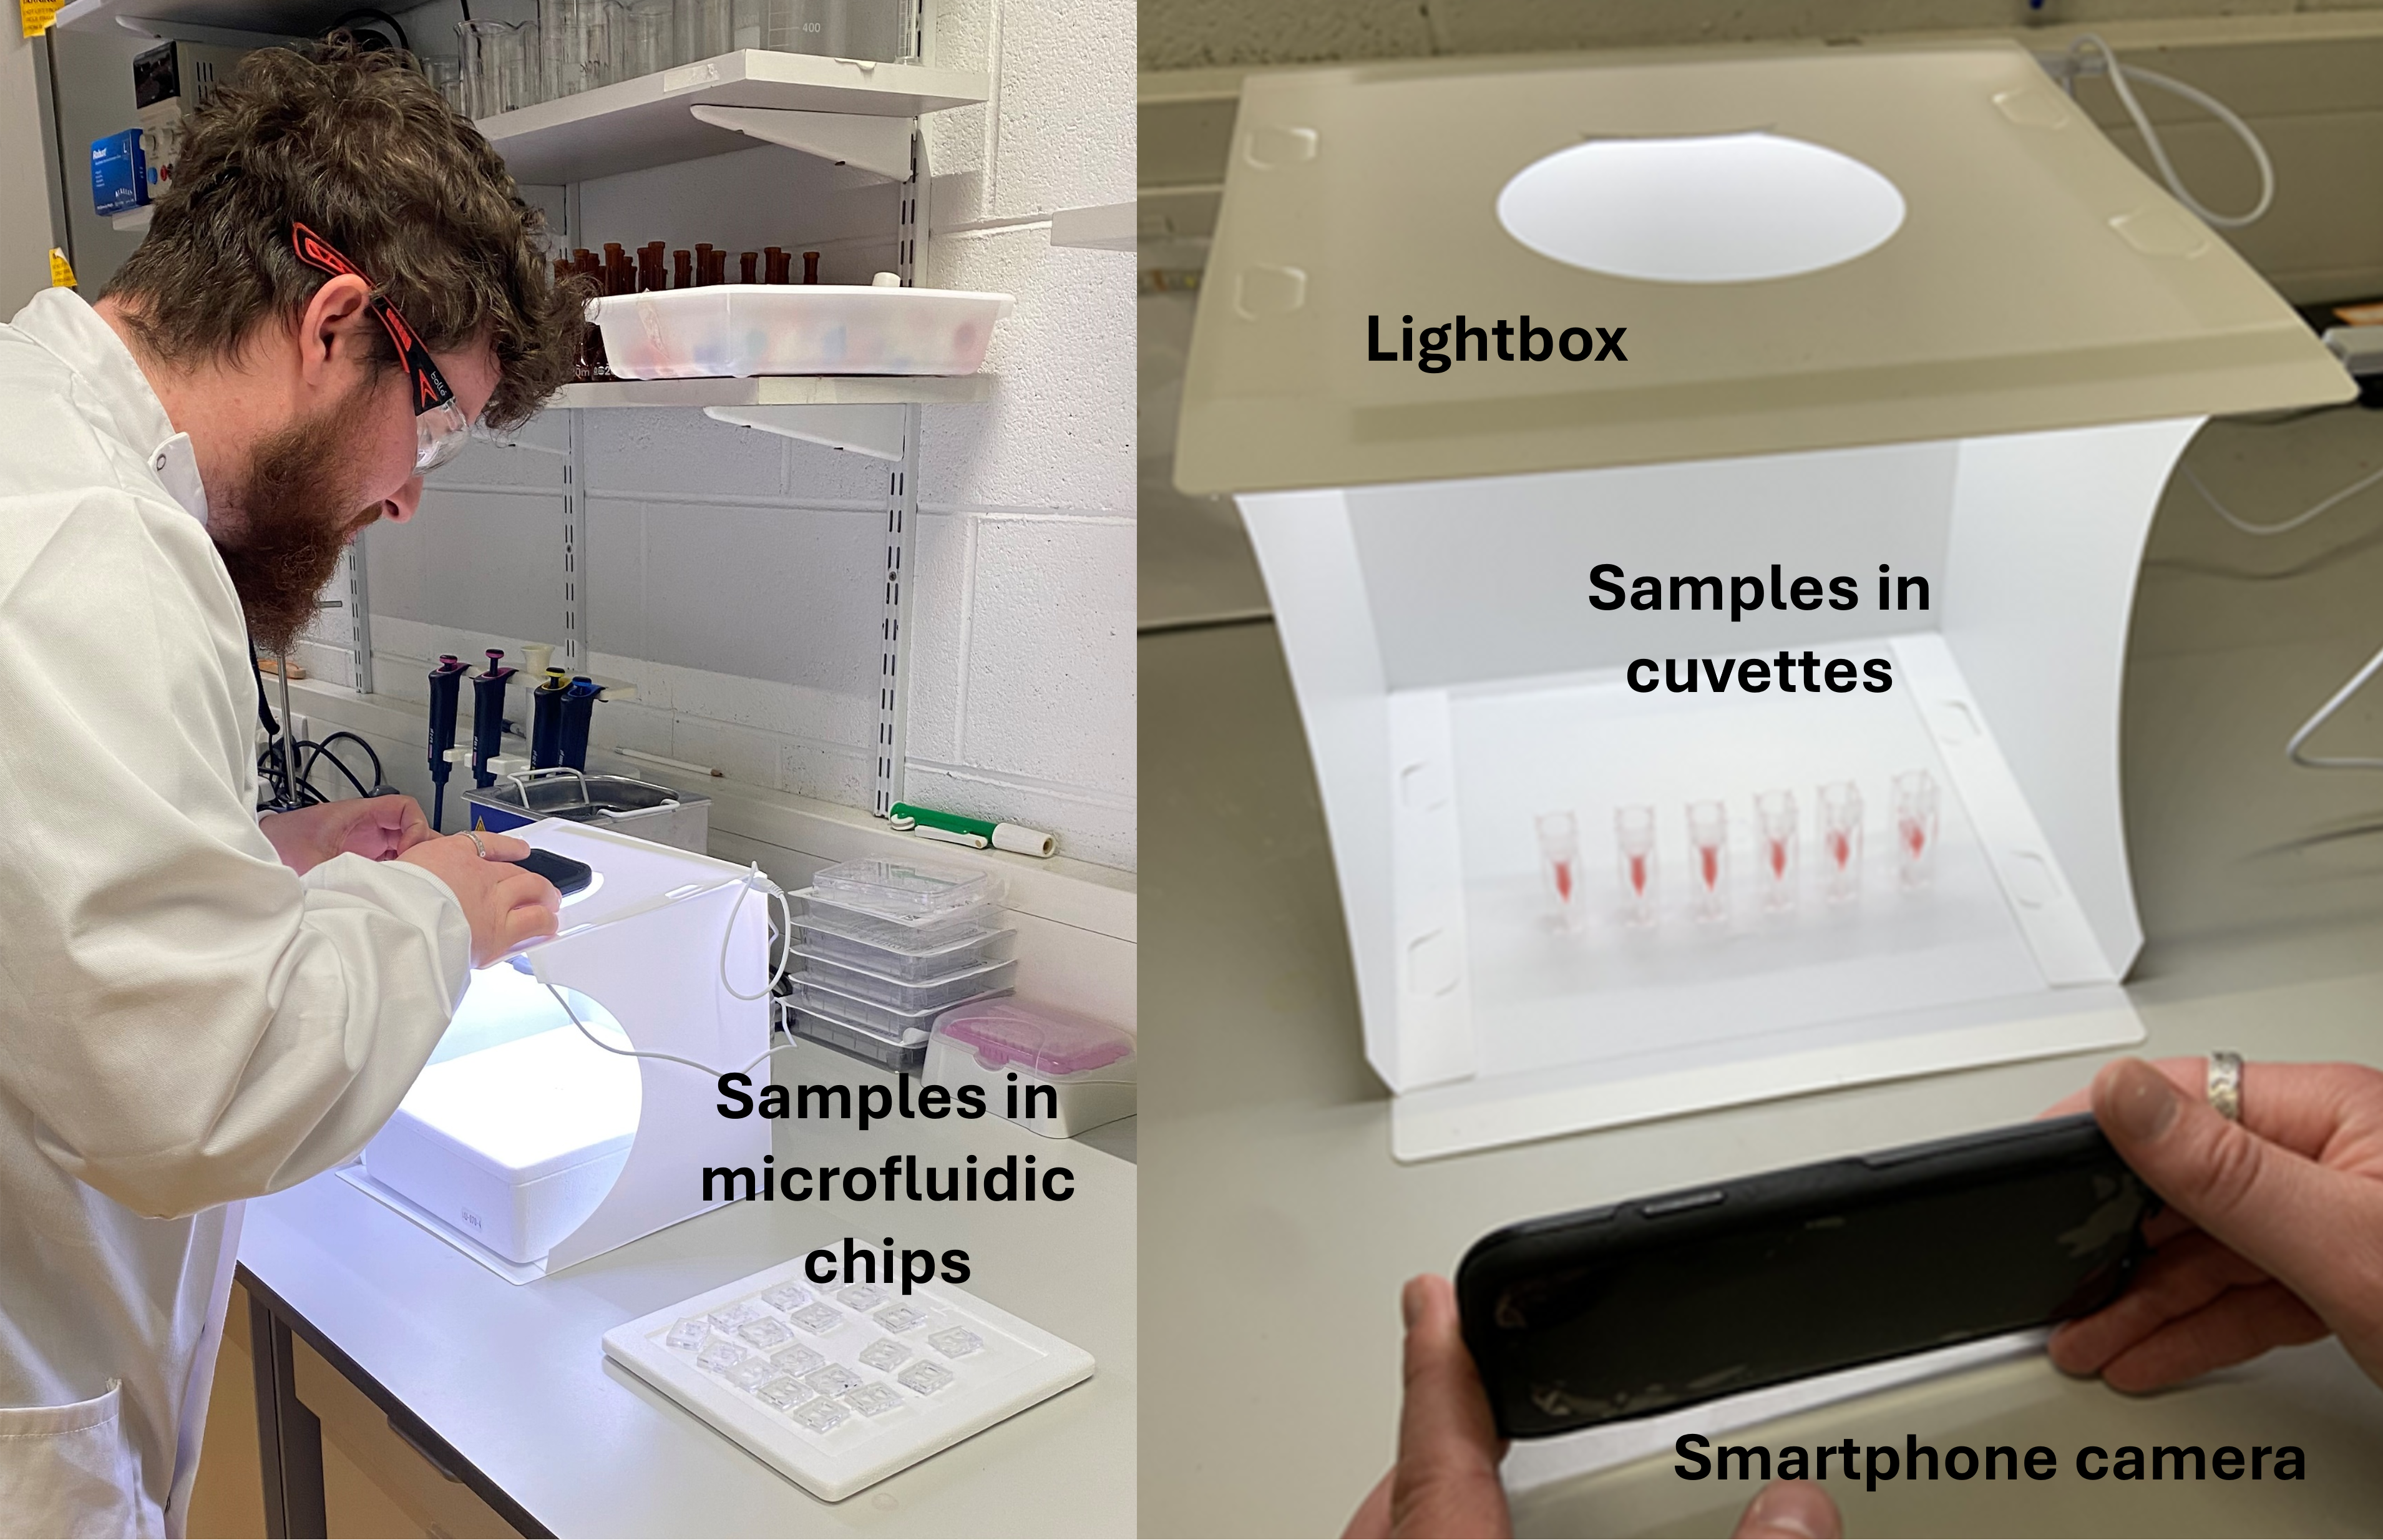
Figure 1. Commercial LED white box used for smartphone image capture of assay solution in microfluidic chips (left) and micro UV-Vis cuvettes (right). Source: DCU (2026)
Key outputs include:
- Rapid on-site concentration estimates of total PAHs (SPAH), covering key compounds such as Phenantherene, Anthracene, Benzo[a]pyrene, Acenaphthene, Acenaphthylene, Benz[a]anthracene, Benzo[b]fluoranthene, Benzo[ghi]perylene, 2-Bromonaphthalene, Chrysene, Dibenz[a,h]anthracene, Pyrene, Fluoranthene, Fluorene, Indeno[1,2,3-cd]pyrene, Naphthalene, and others, based on colorimetric response analysis.
- Quantification of microplastics (particles counts), including fragments, fibers, films and beads from common plastics, such as polypropylene (PP), polyethylene (PE), polyethylene terephthalate (PET), polystyrene (PS), polymethyl methacrylate (PMMA), polycarbonate (PC), and polyvinyl chloride (PVC), and sizes ranging from ca. 10 mm up to 5 mm.
- Visual outputs from field measurements, including color intensity (PAHs) and florescence images (microplastics), enabling transparent interpretation and communication of results.
- Sample-based monitoring dataset across multiple locations and time points, allowing comparison between sites (e.g., hotspots vs low-risk areas) and conditions (dry vs. rainfall events).
- Hotspot screening results, identifying locations with elevated contamination levels that require further investigation, monitoring or intervention.
How does the tool support the implementation of EU Directive 2024/3019?
EU Directive 2024/3019 requires cities to understand where polluted stormwater comes from, how it behaves during rainfall, and how it is monitored over time. This raises a practical question for municipalities and utilities: how do you generate enough field evidence to identify pollution hotspots and meet monitoring obligations without relying only on expensive laboratory campaigns? The Portable Monitoring System provides a first answer by enabling rapid, in-situ screening of microplastics and PAHs directly in stormwater, runoff and overflow points.
In concrete terms, the tool is most relevant to Article 5 and Annex V, which require an evidence based IUWMP and an analysis of pollution sources and loads, including microplastics. It also supports Article 21, which requires representative monitoring of stormwater overflows and urban runoff, and Article 22, which requires regular updates of monitoring datasets. For municipalities, this translates into a simple task: screen many locations quickly, identify where pollution is likely to be significant and focus detailed monitoring where it matters most!
The tool fits most directly into IUWMP Stage 1 – Understand Your Situation. It can be used to:
- Screen runoff at discharge points and identify potential hotspots (Section 1.3)
- Support pollutant ranking with field-based evidence (Section 1.4)
- Flag locations that may require closer assessment of environmental or health risk (Section 1.5).
More conservatively, it also supports Stage 4 - Assess measures and monitor impact, where cities need to monitor whether implemented measures are working. Because the tool is portable and easy to use, it allows repeated screening across seasons and rainfall events, helping build the datasets required for Directive reporting.
The tool is not meant to work alone. It complements the other WATERUN tools along the IUWMP process, by providing quick, on-site evidence of what pollutants are actually present in runoff and overflow points. As such, the Portable Monitoring System supports Tool 2 CleanCityCover by validating or refining pollution hotspots, provides input for Tool 3 MUST-B and informs Tool 4 Risk-based DSS by helping confirm priority areas for intervention by indicating where more detailed risk assessment is needed. In practice, it ensures that these tools are applied based on real field conditions rather than assumptions alone.
What you need to apply it
The tool is designed to be applied directly by municipalities and water utilities without requiring complex laboratory infrastructure. It builds on simple, portable components and standard procedures that have been tested in real urban environments such as Santiago de Compostela (Spain) and Aarhus (Denmark), where it was used to analyze runoff under different weather conditions.
In practice, applying the tool requires the ability to collect runoff samples in the field and process them using portable equipment and simple preparation steps. The system relies on a small set of components and materials, which can be organized along the workflow from sampling to analysis:
- Water samples are collected directly from runoff points using standard containers with glass bottles recommended to avoid contamination. Basic field access to drainage outlets, overflows or receiving waters is required.
- Before analysis, samples are prepared using straightforward procedures such as filtration, and where needed, solid phase extraction (for PAHs) or organic digestion and density separation (for microplastics). These steps require common laboratory consumables such as filters, reagents and glassware, and only basic handling skills.
- The PAH sensor (colorimetric assay) is based on gold nanoparticles that react with PAHs in the sample, producing a color change proportional to concentration. The analysis requires a mixing interface, such as microfluidic chip or cuvette, a smartphone camera, and a controlled lighting setup using a commercial LED white light box. Images are analyzed by extracting color information (RGB values) to estimate total PAG concentration.
- In the microplastic sensor (fluorescence-based), the microplastics are stained with a fluorescent dye and visualized using a dark light box equipped with a blue light source and optical filters to enhance contrast. The box can be produced through 3D printing and is designed for field use. A smartphone camera is used to capture images, and particles are identified and counted based on their fluorescence. The required components (blue light source, filters and basic reagents) are commercially available.
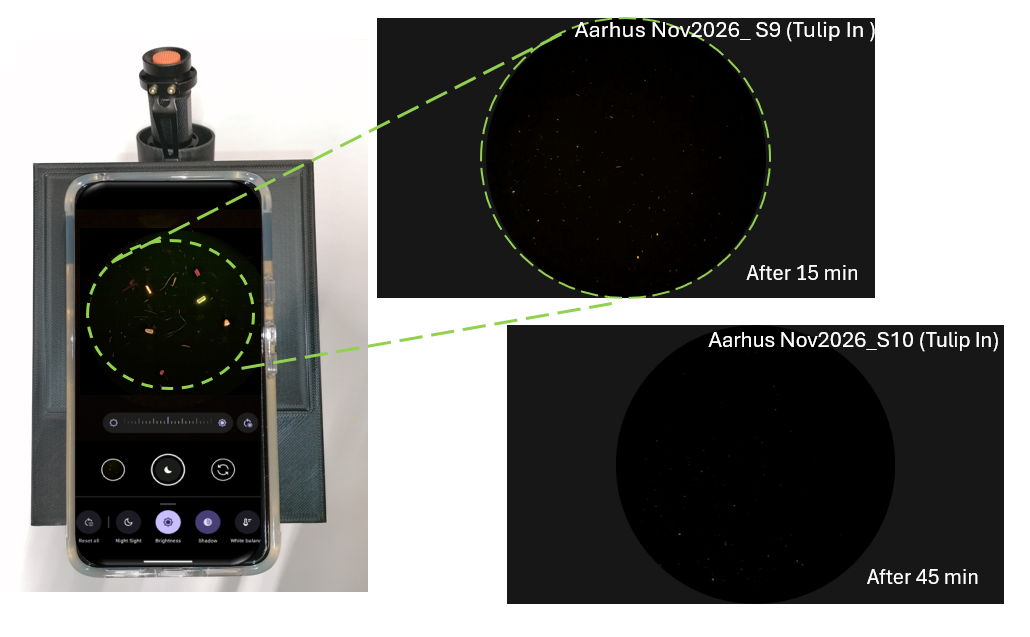
Figure 2. Fluorescence Imaging Box. Source: DCU (2026)
- Image processes is carried out using ImageJ, a free and widely used software for extracting color and particle information from images (ImageJ software can be free downloaded from https://imagej.net/ij/download.html ). Results are then processes and visualized using standard tools such as Microsoft Excel or Google Sheets, enabling straightforward calculation of concentrations and comparison across sampling points.
Overall, the system combines low-cost equipment, accessible materials, and simple procedures, making it feasible for routine monitoring without specialized laboratory infrastructure.
Cost
The tool is based on low-cost, portable components and does not require laboratory infrastructure or proprietary software.
Initial costs are mainly related to setting up the sensing system. This includes a smartphone and a commercial LED light box for PAH analysis, and for microplastics, a compact imaging box (3D-printed or assembled), a blue light source, and optical filters. These are one-off investments and can be reused across campaigns. In 2026, a typical setup can be assembled for approximately EUR 300–800, depending on the equipment already available.
Operational costs are mainly driven by sample collection and consumables used during preparation and analysis. These include filters, solvents, reagents, and, where needed, materials for additional preparation steps. For PAHs, costs are associated with filtration, solvent use (e.g., methanol, acetonitrile), and optional solid phase extraction (SPE) cartridges. For microplastics, costs relate to filtration membranes, staining dyes, and, for more complex samples, digestion reagents such as hydrogen peroxide and iron salts.
Staff time is the main operational cost. The system is designed to be used by trained municipal or utility staff, without requiring specialized laboratory expertise, but it still requires time for sampling, preparation, and analysis (typically around 1–2 hours per sample depending on complexity).
Overall, the tool offers a cost-effective alternative to conventional laboratory methods, enabling more frequent monitoring and faster decision-making while keeping both investment and operational costs relatively low.
Limitations / Scope
The tool is designed for rapid, on-site screening of PAHs and microplastics in urban runoff. It does not replace laboratory-based analytical methods but complements them by enabling faster and more frequent monitoring. Laboratory techniques such as GC-MS or FTIR are still required for confirmatory analysis, especially when regulatory-grade data or detailed compound identification is needed.
Results are influenced by sample quality and matrix effects. For PAHs, suspended solids can reduce signal response by limiting analyte availability, requiring additional steps such as solvent addition or solid phase extraction to improve detection. Even with these improvements, recoveries may vary depending on sample composition and environmental conditions. The tool therefore provides indicative concentrations rather than highly precise quantification in all cases.
For microplastics, the system enables detection and counting of particles down to approximately 10–20 µm, but it does not reliably identify polymer types based on fluorescence alone. Confirmation of polymer composition currently requires complementary laboratory analysis (e.g., ATR-FTIR), which is limited for smaller particles. In addition, results can vary depending on staining efficiency, remaining organic matter, and user-defined image analysis thresholds.
Operationally, the tool works best under controlled or semi-controlled conditions. While designed for field use, full on-site implementation of all steps (especially digestion and filtration for complex samples) may require a basic mobile setup. High variability in runoff samples, such as turbidity, algae content, or contamination, can slow processing and affect consistency.
Overall, the tool provides robust and practical screening capability, but results should be interpreted as part of a broader monitoring and decision-making process rather than as standalone evidence for compliance or detailed chemical characterization.
User Guide – How to Use the Tool in Practice
If the portable sensor kit has already been prepared (reagents ready, imaging setup calibrated, and basic sample preparation materials available), your main task is to collect samples, process them appropriately, and interpret results. If you are setting up the tool for the first time, ensure that calibration curves, reagents, and imaging conditions (lighting, smartphone settings) are standardized before starting analysis.
Once the system is ready, follow these steps:
Step 1 — Collect the sample
Collect at least 1 L of runoff water in clean containers. For PAHs, glass bottles are recommended. For microplastics, only glass or metal equipment should be used to avoid contamination from plastics. Label samples clearly and minimize exposure to external contamination during transport and handling.
Step 2 — Assess sample quality
Visually inspect the sample to determine turbidity and organic content. Clean samples can be processed directly, while turbid samples require additional preparation such as filtration, digestion, or pre-concentration. This decision is critical, as sample matrix effects strongly influence sensor performance and result reliability.
Step 3 — Prepare the sample (PAHs analysis)
Filter the sample and, if needed, apply solid phase extraction (SPE) to remove interferences and pre-concentrate the analyte. Prepare both samples and a set of standards using pre-prepared aliquots of the gold nanoparticle solution to generate a calibration curve. Add buffer and solvent (e.g., methanol), followed by a salt solution to trigger nanoparticle aggregation and the color change used for quantification.
Step 4 — Capture and analyze PAHs signal
Place the prepared sample in the imaging setup (light box or controlled lighting environment) and capture images using a smartphone. Extract RGB values using image analysis software (e.g., ImageJ) and calculate concentrations using the calibration curve. Ensure consistent lighting and camera settings across all measurements for comparability.
Step 5 — Prepare the sample (microplastics analysis)
Filter the sample to collect particles on a membrane. For samples with high organic content, perform digestion (e.g., hydrogen peroxide-based) and, if necessary, density separation before filtration. Stain the retained particles with a fluorescent dye and allow sufficient incubation time to ensure proper staining.
Step 6 — Capture and analyze microplastics signal
Place the stained filter in the fluorescence imaging box and illuminate it with the blue light source. Capture images using the smartphone with the appropriate optical filter to enhance contrast. Analyze images using ImageJ (or similar software) to count particles, applying consistent threshold settings and verifying results against the raw image.
Step 7 — Interpret and validate results
Review results in relation to sample type, preparation steps, and known limitations. Compare values across sampling points (e.g., inlet vs outlet) or over time to identify trends and hotspots. Where needed, complement results with laboratory analysis for confirmation, especially for regulatory or detailed chemical characterization.
This workflow enables rapid, field-adapted screening of PAHs and microplastics in urban runoff, reducing analysis time from days to hours while maintaining sufficient robustness for decision-making and prioritization.
What Decisions Does the Tool Enable?
The tool supports decisions at three levels: strategic, operational, and emergency response.
At a strategic level, it helps municipalities and utilities understand how pollution behaves across the system and where to act. By providing direct, field-based evidence on the presence of PAHs and microplastics, the tool enables baseline analysis and supports wastewater and runoff management planning. It helps identify pollution hotspots that require deeper investigation, as well as areas where runoff is relatively clean and could be considered for reuse (e.g., rainwater harvesting). At the same time, it supports the strategic placement of green infrastructure by distinguishing between zones that need treatment (e.g., bioswales, retention basins) and those that do not. Because the sensors can be applied under different conditions, including rainfall events, they also contribute to climate resilience planning by showing how pollution loads vary under wet, dry, or intense rainfall scenarios.
At an operational level, the tool supports day-to-day monitoring and targeted intervention. Its rapid analysis (on the order of hours rather than days) allows utilities to track pollution across sites, compare inlet and outlet performance, and assess whether existing systems are working as intended. This enables more efficient pollution monitoring as a cost-effective, high-spatial-resolution warning system. It also supports targeted pollution control, helping teams prioritize actions such as street cleaning, maintenance, or localized runoff treatment where they are most needed, instead of applying uniform measures across the network.
At an emergency response level, the tool can support rapid investigation of unexpected pollution events. Because it can be deployed quickly in the field without laboratory infrastructure, it allows teams to check water quality in near real time, identify abnormal pollution signals, and take immediate action or escalate to more detailed analysis if required. This is particularly useful in cases of accidental discharges, first-flush events, or suspected system failures.
A simple way to understand its role is: the tool does not replace detailed modelling or laboratory analysis, but it helps decide where to act, when to act, and how urgently, based on real measurements in the field.
Case Studies
Aarhus, Denmark — Urban ponds and roadside green infrastructure
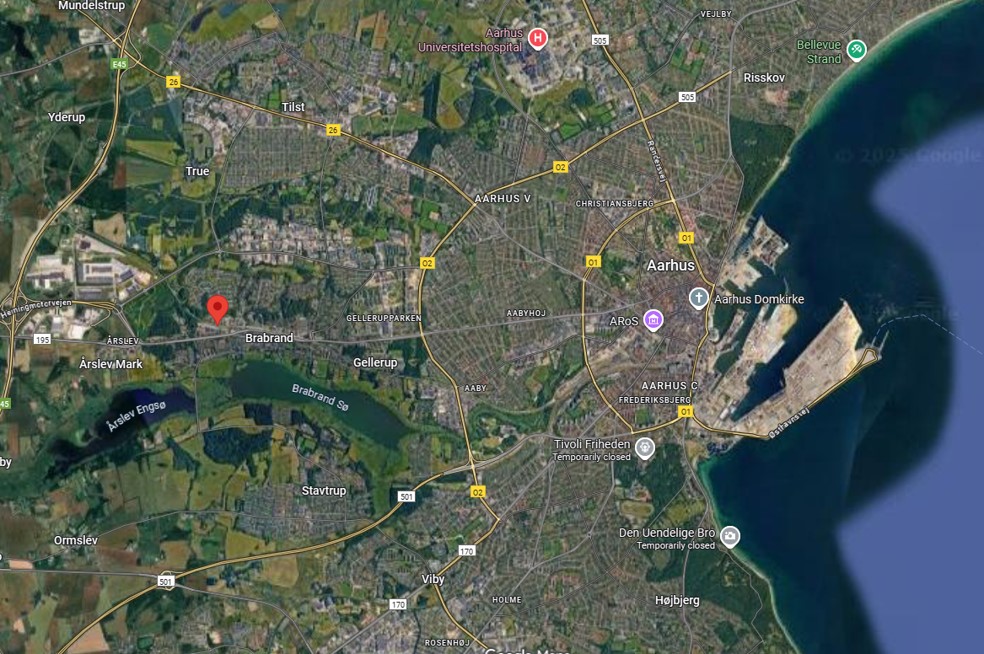
Figure 3. Tulip sampling site, position (highlighted in red) shown in the map of greater Aarhus. Source: GOOGLE MAPS (2026)
The tool was tested in Aarhus across several urban runoff treatment systems, including wet and dry ponds in the Tulip residential area, a roadside system in Risvangen, and a wet pond in the Lystrup industrial zone. Sampling campaigns were conducted in August 2025 (dry conditions) and November 2025 (rain events), combining manual grab sampling and automated sampling triggered by rainfall.
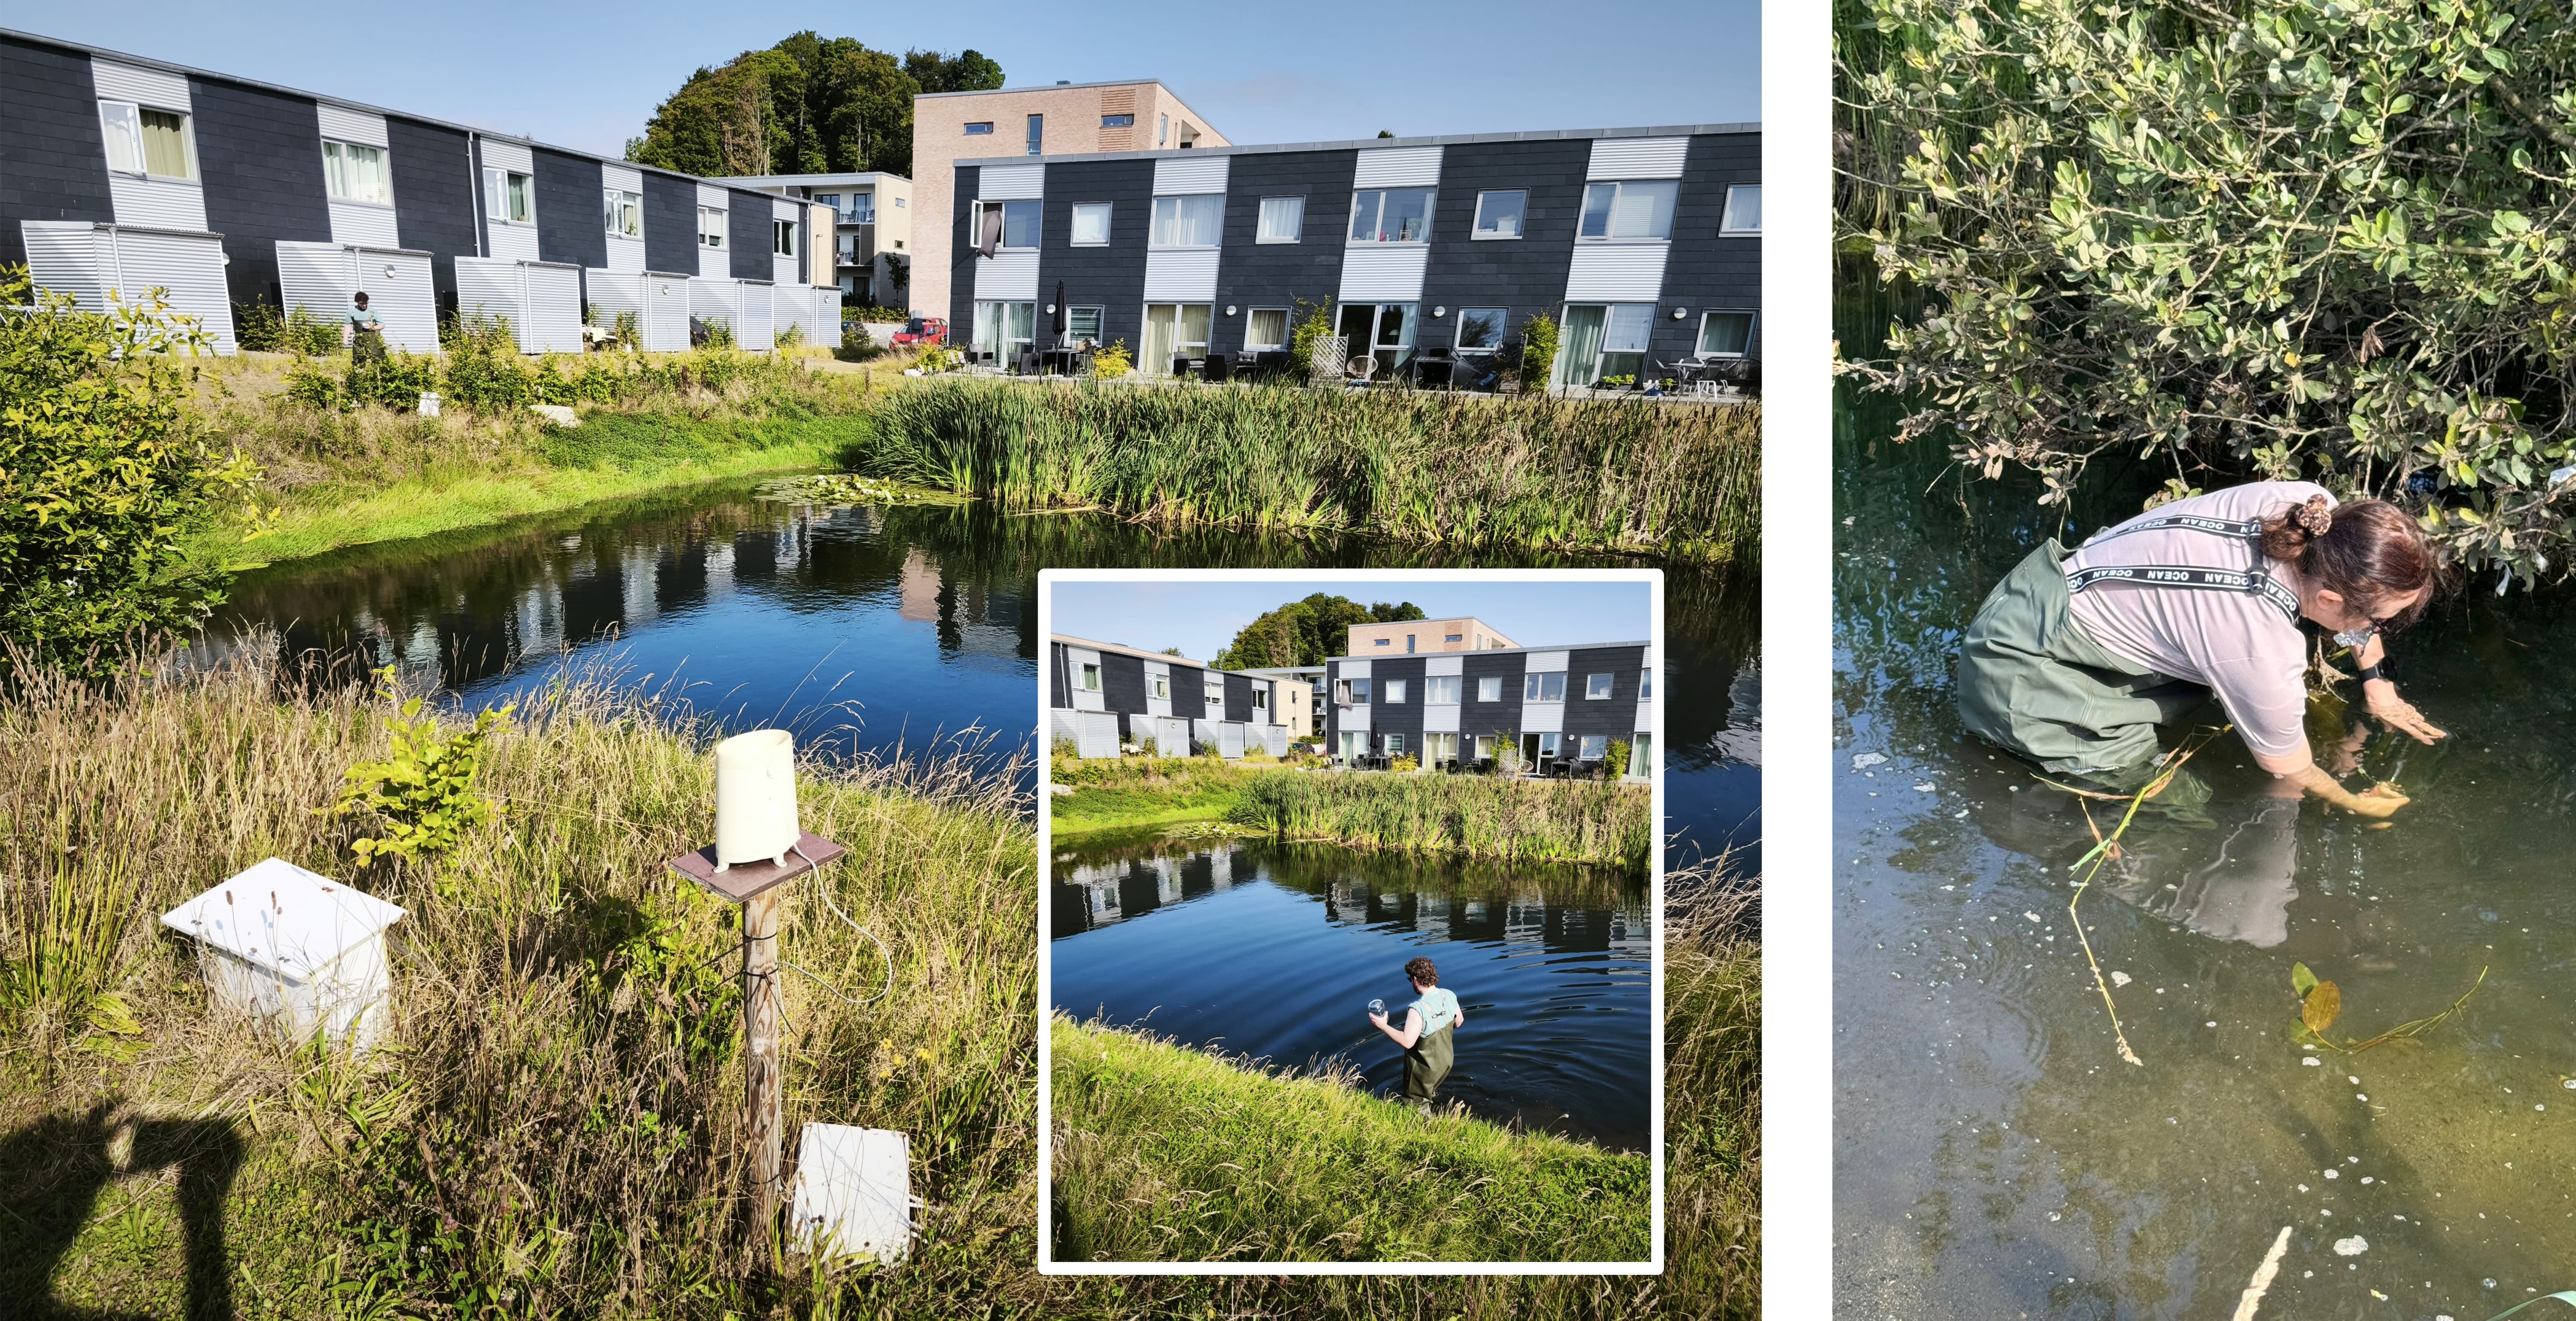
Figure 4. Summer campaign in Aarhus: Tulip wet pond (left) and Skjoldhøjvej wet pond (right) were sampled manually. Source: DCU (2025)
Results showed that the portable sensors could be applied under different field conditions, including stagnant water and active runoff during rain events. For PAHs, the optimization of the sample preparation method enabled detection of concentration concentrations in real samples and allowed tracking of pollutant dynamics between inlet and outlet points. For microplastics, the fluorescence imaging system enabled rapid screening across sites with different characteristics, detecting particles down to 10–20 µm and showing consistent differences between locations.
In several cases, results indicated a reduction in pollutant levels between inlet and outlet points, suggesting that the monitored green infrastructure systems contributed to pollutant retention. The campaigns also demonstrated the importance of sample preparation, particularly in samples with high organic content, and confirmed that the system can support rapid field-based screening across a wide range of urban environments.
Learn more about the Aarhus Case Study
Santiago de Compostela, Spain — Urban runoff treatment systems in industrial areas
In Santiago de Compostela, the tool was applied in two industrial areas: the Sionlla bioremediation treatment train and the Ptolomeo Street biofiltration system. Two field campaigns were conducted in July 2025 (dry weather) and January 2026 (rain events), allowing testing under contrasting hydrological conditions.
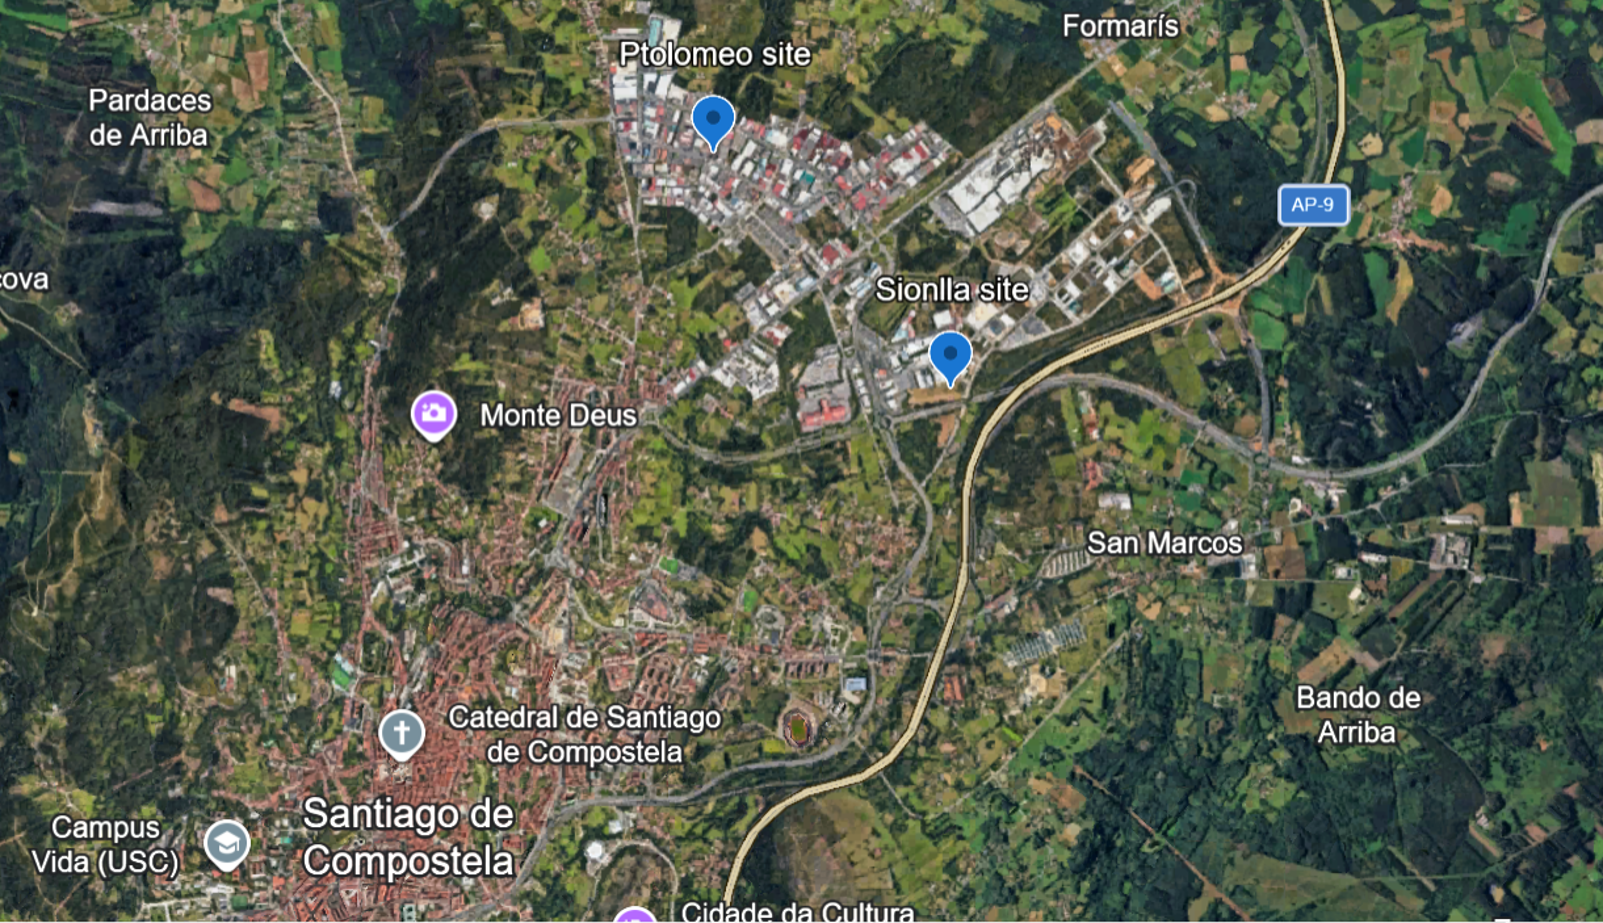
Figure 5. Sampling sites at Santiago de Compostela, Sionlla and Ptolomeo sites, shown in the map of greater Santiago de Compostela. Source: GOOGLE MAPS (2026)
Sampling focused on multiple points along the treatment systems, including inlets, intermediate stages, and outlets. This enabled tracking of pollutant behavior along the treatment chain.
For PAHs, results showed that concentrations could be detected and compared across system stages, with evidence of decreasing concentrations from inlet to outlet in some cases, particularly after applying sample preparation methods such as solid phase extraction.
For microplastics, the system enabled rapid visualization and counting of particles in real runoff samples. Results showed a marked decrease in particle counts after water passed through treatment units, indicating the potential of these systems to retain microplastics. The campaigns also highlighted practical challenges such as matrix effects, sediment presence, and the need for digestion in highly contaminated samples.
Overall, the Santiago case confirmed that the tool can be applied to complex treatment systems, providing fast, on-site evidence of pollutant presence and supporting the evaluation of green infrastructure performance under both dry and wet conditions.
Learn more about the Santiago Case Study
Contact Information
The Portable Monitoring System for microplastics and PAHs was developed by researchers within the Water Institute and the School of Chemical Sciences at Dublin City University (DCU), Dublin (Ireland), as part of the EU-funded WATERUN project.
For questions about the tool, its application, or potential collaboration:
- Caoilte O’Rourke O’Cuirrin: caoilte.orourkeocuirrin43@mail.dcu.ie
- Marianna Zolyomiova: marianna.zolyomiova3@mail.dcu.ie
- Fiona Regan: fiona.regan@dcu.ie
- Mercedes Vázquez: mercedes.vazquez@dcu.ie
- Department of Chemistry: https://www.dcu.ie/chemistry
- Water Institute: https://www.dcu.ie/water
CRM48905 –PAH Reference Standard Mix (16 PAHs)
Product 1: Portable Monitoring System
WATERUN Project
This is the official webpage of WATERUN, an EU-funded Horizon Europe research project focused on sustainable urban water runoff management. It develops innovative methodologies based on Water-Sensitive Urban Design (WSUD), offering cities both preventive and mitigation solutions for urban water challenges.
WATERUN.EU (2022): https://www.waterun.eu/ [Accessed: 15.04.2026]WATERUN'S Products: Sensors to better analyze water samples
A video with Dr. Mercedez Vazques, describing the Portable Monitoring System developed in the framework of WATERUN.
OiEau - International Office for Water (2025): https://www.youtube.com/watch?v=IUQX-w2aUe0 [Accessed: 15.04.2026]