Author: Boney Anna Joseph, Technical University of Berlin (TUB)
Disclaimer: This tool description originates from the WATERUN Deliverable D5.6 compiled by UNIVPM, Guidance of WATERUN UWR Management Methodology. WATERUN Project, EU Horizon Europe Grant Agreement No. 101060922.
Tool 2. CleanCityCover: Critical pollutant source identification software
The European Union recast Urban Wastewater Treatment Directive (EUROPEAN PARLIAMENT & COUNCIL OF THE EU 2024) emphasises the need to improve stormwater management in cities by reducing the risk of pollution due to heavy rainfall-runoff events. Tackling the diffuse pollution in surface and groundwater bodies due to urban runoff requires a source area approach. PATON AND HAACKE (2021) categorized the sources of diffuse pollution according to their intrinsic patterns of pollution source areas considering their spatial and temporal variations. It was shown that there is a need to assess these source areas in terms of their structural and functional connectivity of pollutant transfer to enable an adequate management of urban surface pollution.
The term structural connectivity refers to the physical connection between polluted urban surfaces, and the functional connectivity describes the dynamic processes within these structurally connected surfaces that impact the transport and fluxes of water and particles between source and outlet (WAINWRIGHT et al., 2011). We adapted this holistic approach to develop a diffuse pollution identification tool for urban sealed surfaces called CleanCityCover. The purpose of the tool is the identification of particularly contaminated urban areas contributing the largest amount or the highest toxicity levels to diffuse pollution.
CleanCityCover is a web-based interactive application developed using the Shiny package in R. It consists of three components: a multi-facet database (highlighted in blue in Figure 1), a SWMM modelling component for structural and functional connectivity analysis (highlighted in orange) and a shiny app interface (highlighted in green). The database contains meteorological information on rainstorm characteristics, high-resolution geodata detailing the surface types down to the building scale, and a pollution database with information on urban pollution build-up and transfer such as wet and dry deposition, street and traffic pollution, abrasive pollution from metal roofs and many more.
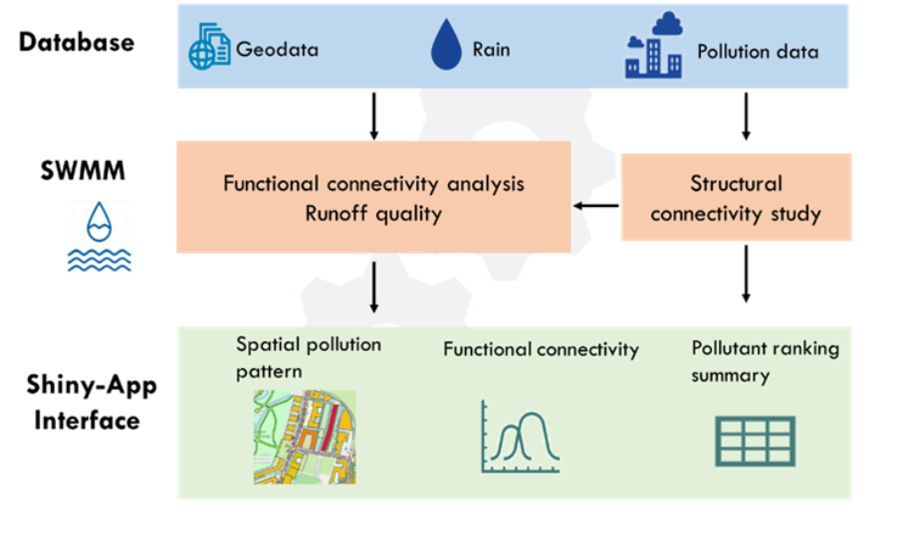
Figure 1: Three components of the tool CleanCityCover: Database, SWMM modeling and Shiny App Interface. Source: OWN ELABORATION (2026a)
The functional connectivity, i.e. the potential to transfer pollutants with overland flow, is assessed by computing the overland flow from a hypothetical street surface in SWMM using one-minute rainfall over a time period of ten years. In a next step, three years (dry, wet and flashy) are identified and selected to assess annual pollution loads.
Urban diffuse pollution data collected from a large range of field studies (LIU et al., 2013; REVITT et al., 2022; GALSTER & HELMREICH, 2022) are used to parameterise the spatial pollution pattern of different pollution types for associated surface covers (streets, pavements, squares, roofs) on the city scale. The structural connectivity of the source areas to the drainage system or groundwater is evaluated and the runoff quality is computed in SWMM for the three selected years using the information on pollutant spatial patterns, build-up and wash-off parameters after TU & SMITH (2018). Finally, the priority ranking of areas and pollutants (1 to 4) is calculated by considering the runoff quality, toxicity of the pollutant and the extent of treatment required for discharge into water bodies. Results of structural and functional analysis and ranking of diffuse pollution are then visualized in a web-based interface of Shiny app (Figure 2).
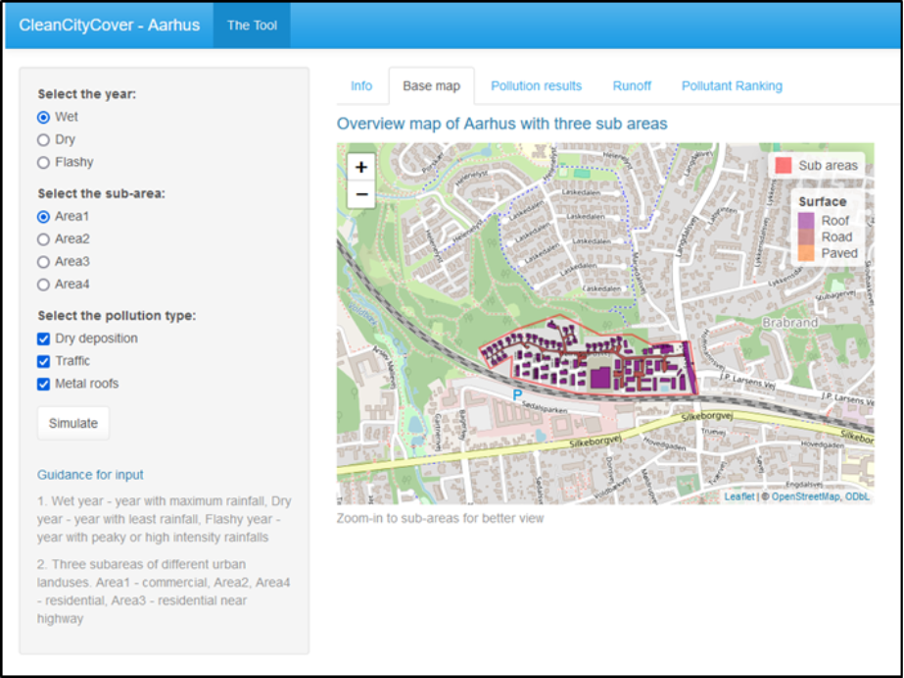
Figure 2: CleanCityCover interface upon launch featuring the default tab ‘Base map’ zoomed to one of the sub-areas. The Input panel is seen on the left with the three fields to be selected by the user. Source: SHINYAPP (2026a)
Target users, benefits and answers to the EU directive
The purpose of the tool is the identification of particularly contaminated urban areas contributing the largest amount or the highest toxicity levels to diffuse pollution, but also the opposite the identification of particularly clean surface areas as potential locations for rainwater harvesting. The tool may also be used to find the most adequate locations to implement nature-based solutions for targeted pollution control and ranking priority areas for future remediation actions.
The tool is designed to be used for managers and engineers of water boards, city or district councils, environmental departments, water companies and urban drainage companies.
In addition, it can support the elaboration of integrated urban wastewater management plans (IUWMP) as required by the EU Directive 3019/2024. Particularly, the CleanCityCover can support the elaboration of IUWMP by:
- Identifying critical source areas of urban diffuse pollution on a city or district level supports the implementation of integrated urban wastewater management plans (answering article 5).
- Pollutant ranking system and the runoff quality information in the tool helps in planning the right WSUD elements (answering article 5).
Requirement for implementation
CleanCityCover is a web-based interactive application developed using the Shiny package in R. As shown in Figure 1, the tool involves an extensive dataset, modelling part and the final tool interface developed in R programming language. The data requirement of the tool is detailed in Table 1.
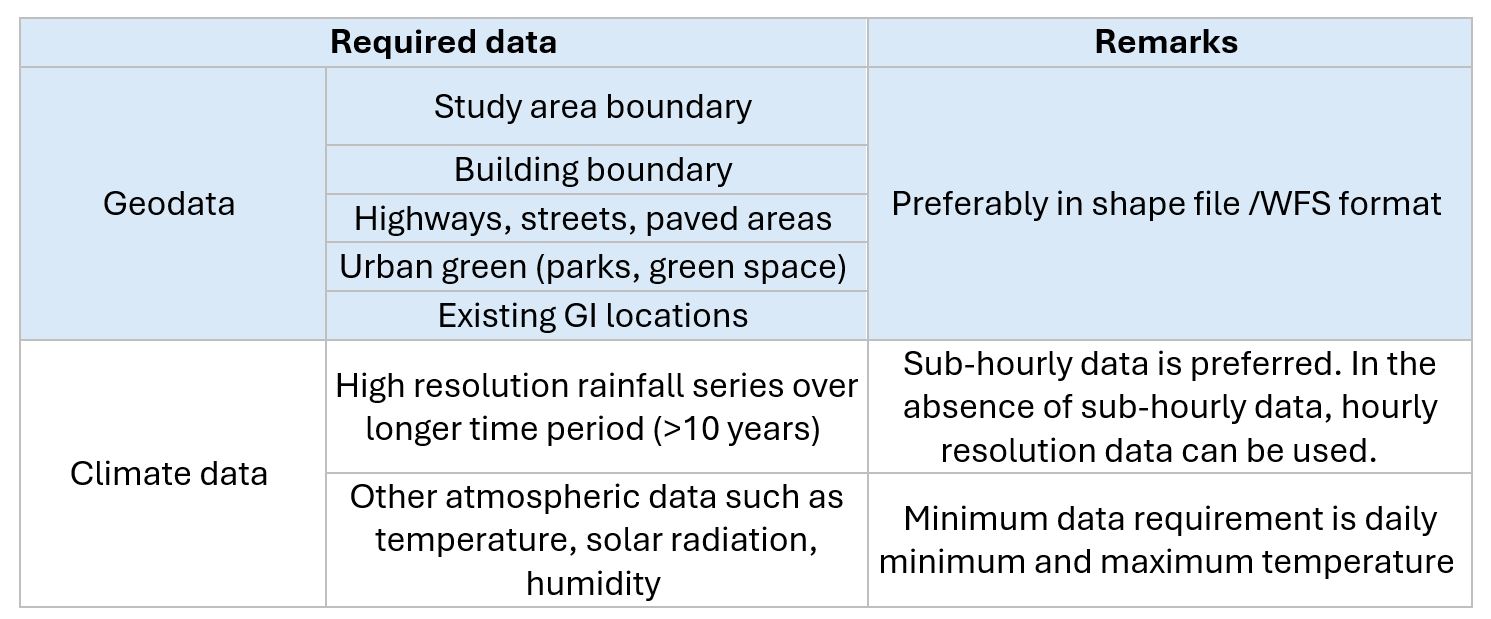
Table 1: Details of required data for the CleanCityCover. Source: OWN ELABORATION (2026b)
In addition to the data requirement detailed in Table 1, SWMM is used for the functional connectivity analysis (runoff computation) and the runoff quality modelling. The EPA SWMM is a free software, used for a dynamic rainfall-runoff simulation of runoff quantity and quality from urban areas for single event or long-term (continuous). For preparation and processing of geo-data, any GIS application like QGIS or ArcGIS can be used. Finally, the tool itself is a Shiny-app developed using R programming language in R studio v4.2.2.
Availability & accessibility
A standalone/offline R script version of the tool will be permanently archived and is available through the final WATERUN Zenodo repository. The tool is accompanied by a User manual and a Reference Manual available on WATERUN Zenodo repository. The User Manual details how a user can navigate the tool, describes its features and functionalities. The Reference manual provides comprehensive guidance on how the tool can be developed and parameterised for another city, illustrated using WATERUN case study areas in Aarhus, Denmark as an example.
Costs involved in developing the tool
The cost involved in the development of CleanCityCover can be summarized into following categories:
- Data acquisition costs: This could vary from city to city. While data such as high-resolution climate data are openly available for the majority of European cities, access to detailed geospatial data may involve additional costs.
- Software costs: EPA SWMM and GIS software such as QGIS are open-source software. However, the computational requirements for longer simulation and larger spatial scales should be considered.
- Personnel cost: The development of the tool requires a skilled modeler with expertise in runoff quality modelling and proficiency in R programming language.
- Costs in runoff quality sampling (if the tool is to be validated): If the tool is to be validated for pollutants and areas, runoff samples should be collected for at least a year, and the water quality need to be analysed.
Simplified protocol for the use of Tool 2
A simplified protocol for the use of CleanCityCover is given in this section illustrating the tool developed for the WATERUN case study areas in Aarhus as an example. The tool upon launch opens a web page (Figure 3) with an input panel on the left and five tabs on the top with the tab ‘Base map’ displayed by default. The input panel consists of three fields – ‘year’, ‘sub-area’ and ‘pollution type’ to be selected by the user. The user can choose between a wet, dry and flashy year and can select one of the three sub-areas. The tab ‘Base map’ to the right of the panel comprises an overview map of the city with its sub-areas. Clicking on the ‘Simulate’ button, the tool activates and displays the results in the various tabs.
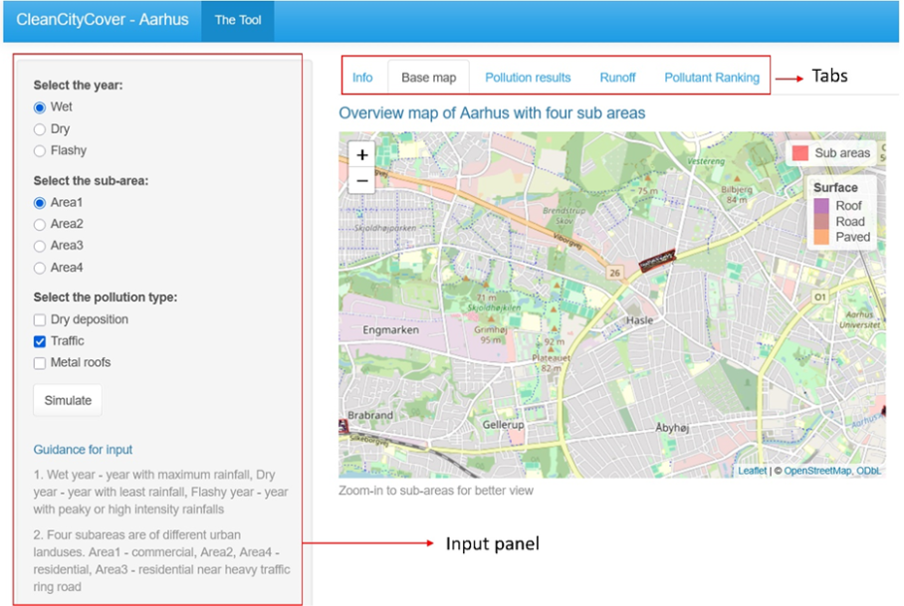
Figure 3: CleanCityCover interface upon launch, featuring the default tab ‘Base map’ with the subareas. The Input panel is seen on the left with the three fields to be selected by the user and the ‘Simulate’ button on the bottom. The additional tabs are visible on the top. Source: SHINYAPP (2026b)
Decision-making capability
By using CleanCityCover, users can find support for planning future managing of UWR by:
- Identifying relevant source areas from where significant amounts of pollution that end up in urban water are generated. This helps in deciding where in a drainage area intervention related to diffuse pollution need to be implemented.
- Giving information on what level of measures (WSUD elements) need to be implemented on different drainage surfaces.
Application to WATERUN case studies
CleanCityCover is parameterized for the WATERUN case study areas and field sites within Santiago de Compostela, Spain and Aarhus, Denmark . It is validated for two case study areas in Aarhus.
Aarhus (Denmark)
CleanCityCover was parameterised for four sub-areas in Aarhus, Denmark. These sub-areas are detailed in Table 2. Area1 is located in the heart of the city with predominantly commercial land use and large paved areas. A major road with heavy traffic runs through this sub-area, which also contains a substantial number of copper roofs. Area2 is a newly developed residential area away from the city with existing green infrastructure (wet pond). The roads are of low traffic, and the buildings in this location have galvanized roof gullies. Area3 is a residential area situated along the major outer ring road in Aarhus. Area4 is again a residential area with existing green infrastructure (dry pond).
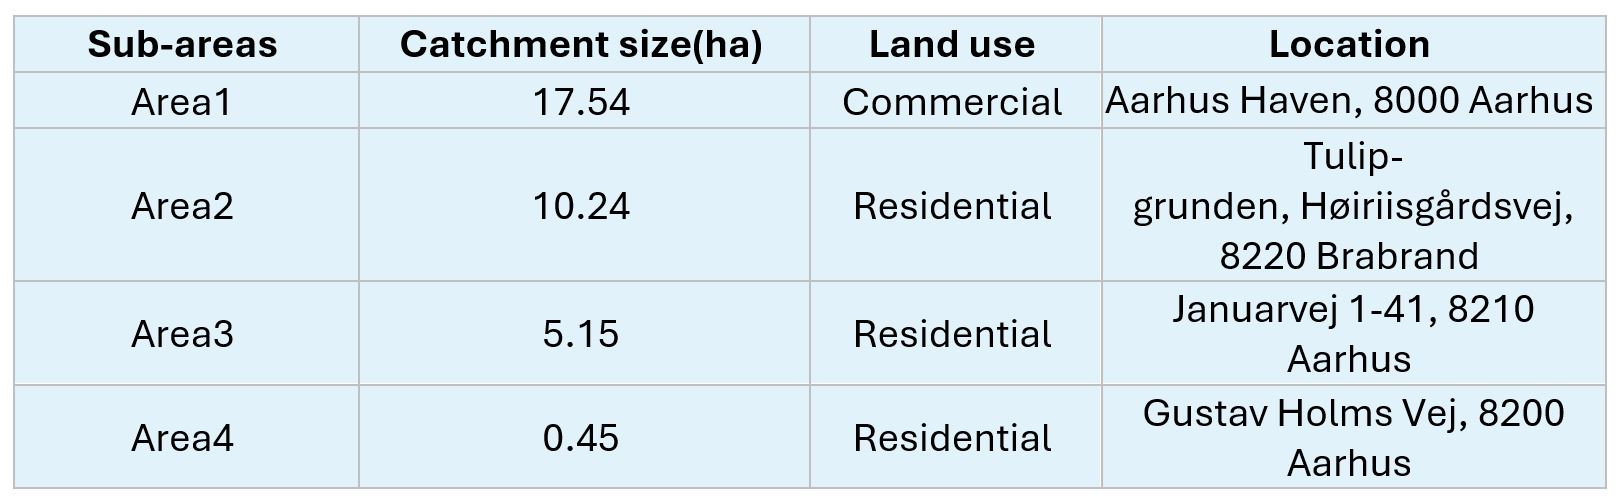
Table 2: Overview of the sub-areas in Aarhus for which the CleanCityCover tool has been parameterised. Source: SHINYAPP (2026c)
The tool parameterised for Aarhus is currently available in the following temporary link: https://boneyj.shinyapps.io/app2/
Santiago de Compostela (Spain)
CleanCityCover was parameterized for four sub-areas in the city of Santiago de Compostela. The four sub-areas are detailed in Table 5. Area1 is located in the heart of the city close to the Cathedral. This area is of commercial land use with paved areas for pedestrians and minor road traffic. The subarea ‘Area 2’ is a residential area north to the city and has a road of medium traffic passing along. The sub-area ‘ Area 3’ is a commercial area close to the national highway. The sub-area ‘Area 4’, one of the WATERUN case study area is of commercial land use and is located to the north-east of the city. It consists of roads with significant traffic volume. The tool includes three pollution types - dry deposition, traffic and metal roofs (Figure 7).
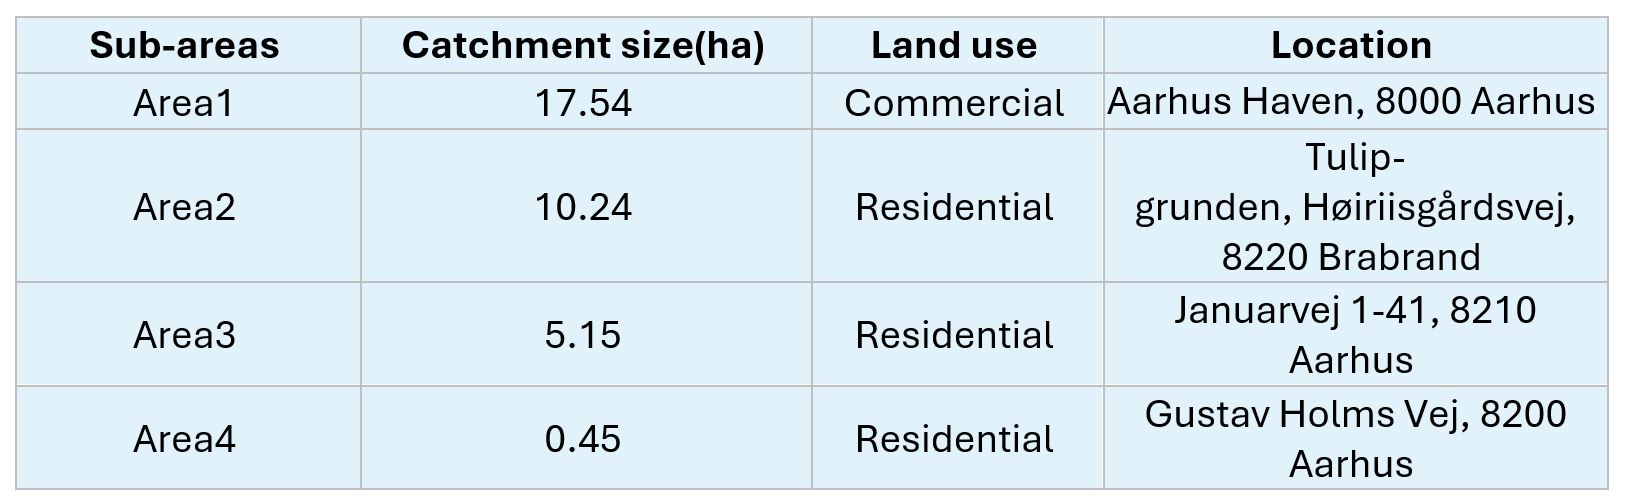
Table 3: Overview of the sub-areas in Santiago de Compostela for which the CleanCityCover tool has been parameterized. Source: SHINYAPP (2026d)
The tool parameterised for Santiago de Compostela is currently available in the following temporary link: https://boneyj.shinyapps.io/app_Santiago/
Developer and contact information
CleanCityCover was developed by the: Technical University Berlin, Germany.
Contact information:
Ecohydrology and Landscape Evaluation
Institute of Ecology
Technical University of Berlin
Ernst-Reuter-Platz 1
10587 Berlin
Influence of Rainfall and Catchment Characteristics on Urban Stormwater Quality
Linking environmental régimes, space and time: Interpretations of structural and functional connectivity
Deliverable D5.6. Guidance Document on WATERUN Tools for IUWMP Support
This document consolidates the working procedures and implementation protocols of the four WATERUN tools (PRODUCT1–PRODUCT4) and presents their application to the Santiago de Compostela, Aarhus and Amman case studies, including the Blue-Green Infrastructure deployed in the Tambre and Sionlla industrial areas of Santiago.
WATERUN CONSORTIUM (2025): Deliverable D5.6. Guidance Document on WATERUN Tools for IUWMP Support. WATERUN Project, EU Horizon Europe Grant Agreement No. 101060922. Lead Beneficiary: UFZ. Document not yet publicly available.WATERUN Project
This is the official webpage of WATERUN, an EU-funded Horizon Europe research project focused on sustainable urban water runoff management. It develops innovative methodologies based on Water-Sensitive Urban Design (WSUD), offering cities both preventive and mitigation solutions for urban water challenges.
WATERUN.EU (2022): https://www.waterun.eu/ [Accessed: 15.04.2026]