Compiled by: Johanna von Toggenburg, seecon international gmbh
Reviewed by: Dr. Darla N. Nickel, Berliner Wasserbetriebe
Stage 1: Understand Your Situation
In Stage 1, you develop the foundation of an Integrated Urban Wastewater Management Plan (IUWMP). It establishes a clear baseline of how your urban wastewater system performs today and how it will need to evolve to meet future requirements. This factsheet will take you through 5 sections to get there:
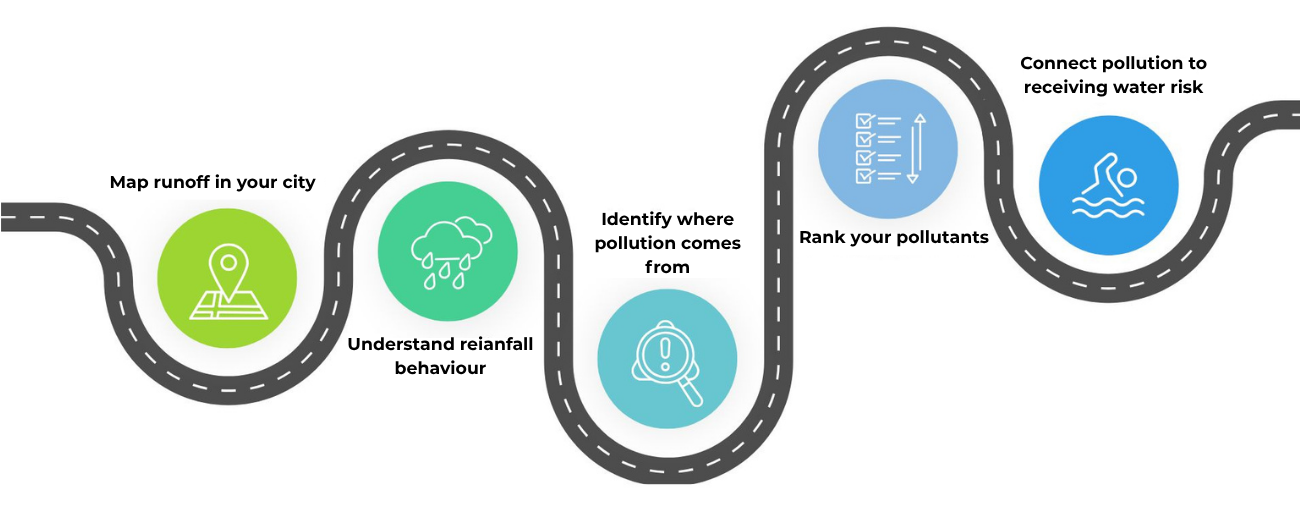
Figure 1: Overview of the sections in IUWMP Stage 1. Source: OWN ELABORATION (2026)
Before setting targets or choosing measures, you need a clear picture of how your drainage system behaves when it rains, i.e. the ‘Analysis of the initial situation of the drainage area’ (EUROPEAN PARLIAMENT & COUNCIL OF THE EU 2024).
Start by asking yourself three questions:
- 1. How does runoff move in your city?
- 2. Where does pollution come from?
- 3. Where does it end up what impact does it have?
1.1 Map runoff in your city
Begin with mapping what you already know. If available, assemble available documentation, such as:
- Sewer network maps (combined and separate)
- Locations of combined sewer overflows (CSO) and discharge points
- Storage structures and pumping stations
- Wastewater treatment plant information
- Flood records and incident reports
Check if the data is up to date and completed, based on experience of colleagues working in the field. Then, ask the following questions:
- Where are known problem spots?
- Are storage volumes known?
- How often they spill and how much do they discharge?
- Which areas flood first?
- Where are the sensitive receiving waters?
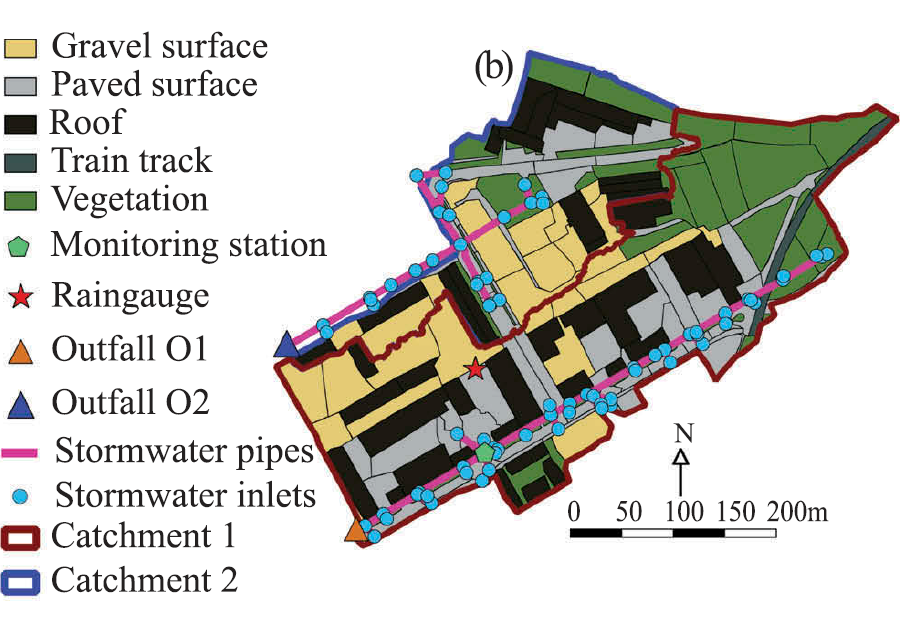
Figure 2: with surface classification and stormwater network mapping. Source: KHADKA et al. (2020)
Divide the drainage area map into manageable units, for instance by sewer districts, overflow catchments, pumping station zones as well as natural topography. These sub-catchments will make it easier for you to understand rainfall behaviour, which we look at next (VSA 2025; REGIERUNGSRAT BASEL-STADT 2012). Use hydrological catchment boundaries, not administrative ones. If your city receives wastewater from surrounding municipalities, you will need to account for those flows. Record the data source, date of last update and confidence level in the information shown.
WATERUN Tool 3: Must-B conducts block-level drainage mapping.
1.2 Understand rainfall behaviour
Annex V of the EU Directive 2024/3019 requires a dynamic understanding of wet-weather flows. In practice, this means translating rainfall behaviour into concrete implications for your sub-catchments, overflows and receiving waters.
Collect and review:
- Historical rainfall series
- Flow measurements at key points
- Overflow frequency records
- Past design assumptions
The reliability of the information can be checked by asking whether records include wet years and extreme weather events, if measurements were continuous and if monitoring points are representative of critical sub-catchments.
For each sub-catchment, consider how it reacts to rain:
- Estimate imperviousness (% sealed surfaces)
- Identify storage structures and capacities
- Identify overflow points
- Estimate response type (fast / moderate / buffered)
- Identify where discharged water flows
Once you have overlayed this information with the drainage map, you can test a few representative rainfall scenarios, such as a wet year or a high-intensity event to see which areas are most sensitive. If a hydraulic model exists, simulate representative rainfall conditions. If climate projections are available, you can apply a stress test, by simulating a stronger peak rainfall (WILLEMS et al., 2012), and seeing which overflows will spill more often and which waters become more vulnerable.
If rainfall and flow data are weak, you can install temporary flow meters at critical overflows, add rainfall gauges in representative areas, and monitor data for 6-12 months to improve the baseline reliability (MAINE DEP 1994). Focus on the gaps that most affect your risk picture. Online turbidity measurements can serve as a cost-effective surrogate for pollutant loads (METADIER & BERTRAND-KRAJEWSKI 2012).
- WATERUN Tool 3: Must-B simulates runoff under various rainfall scenarios
- WATERUN Tool 4 Risk-Based DSS simulates urban runoff flows and pollutant transport in the sewer network during rainfall events, calibrated with local field data through the SSWM hydraulic modelling.
1.3 Identify where pollution comes from
Urban runoff is not uniform: a small proportion of surfaces typically generates a disproportionate share of pollution (REVITT et al. 2022). Your job is to find out which ones.
Gather the following information to start with:
- Water quality monitoring results
- Incident logs
- Complaint records
- Industrial discharge permits
- Land-use maps
Next, map which surfaces generate the most polluted runoff, for instance: industrial areas, high-traffic roads, roofs with metal leaching, construction areas, etc. (GALSTER & HELMREICH 2022). If data is sparse, you can conduct targeted rainfall sampling, visual inspections at discharge points, surface-based screening and expert judgement. Do not solely rely on land-use maps since pollution patterns at street level are not always explained by mapped land use alone (LIU et al. 2013).
Remember: not all surfaces need treatment! Identifying clean areas lets you focus resources on genuine hotspots. Clean runoff may be suitable for rainwater harvesting. Separating clean from polluted runoff and managing at source is the central principle of several national frameworks (MINISTÈRE DE LA TRANSITION ÉCOLOGIQUE 2021; VSA 2025).
WATERUN Tool 2 Clean City Cover addresses this stage.
WATERUN Tool 1 Portable monitoring provides the possibility for screening micropollutants and PAHs directly in the field.
1.4 Rank your pollutants
EU Directive 2024/3019 requires an estimation of pollution loads during rainfall, including nutrients, suspended solids, microplastics and relevant pollutants. You can combine existing monitoring data with targeted sampling during rainfall and surface-based screening or even consult the archive of complaints and environmental incidents.
For each sub-catchment, score pollutants based on:
- Observed concentration (if monitored)
- Likely generation intensity (traffic, roofing, industry)
- Toxicity
Urban runoff is a significant pathway for exceedances of Environmental Quality Standards, particularly for metals and PAHs (EEA 2024; GNECCO et al. 2005). Consider both regulated substances and pollutants of emerging concern. Bear in mind that first-flush dynamics can dominate annual loads (KAYHANIAN et al. 2012; METADIER & BERTRAND-KRAJEWSKI 2012). The ranking helps guide monitoring refinement, informs Stage 2 target setting and prevents over-focus on low-risk parameters.
WATERUN Tool 2 Clean City Cover addresses this stage. Check the special factsheet on ‘Identifying where pollution comes from and ranking the pollutants’
1.5 Connect Pollution to Receiving Water Risk
For each overflow or runoff discharge point, assess its downstream context. Consult existing environmental and regulatory information, such as:
- Ecological and chemical status of the receiving water under the Water Framework Directive 2000/60/EC
- Environmental Quality Standards for priority substances (EUROPEAN PARLIAMENT & COUNCIL OF THE EU 2008)
- Bathing water classifications and temporary restrictions (EUROPEAN PARLIAMENT & COUNCIL OF THE EU 2006)
- Drinking water protection zones
- Natura 2000 or other protected areas
- Documented rainfall-related exceedances or incident reports
Ask: does the discharge reach a sensitive or protected water body? Is there evidence that rainfall events coincide with deterioration? If the answer indicates potential impact, flag the location as a priority zone. Where a water body is already impacted, distinguish between locally caused and upstream-caused pressures so you can target your own measures (MUELLER et al. 2020). The UK Environment Agency’s three-stage WFD risk approach (screening → scoping → impact assessment) provides a practical template for linking a discharge point to status-class deterioration (ENVIRONMENT AGENCY 2017). The STOPUP project’s case-study URUQ-MAPs apply this risk-based logic across several European cities (STOPUP CONSORTIUM 2025).
WATERUN Tool 4: Risk-based DSS addresses this stage.
WATERUN Tool 1 Portable Monitoring System - Rapid Detection of Microplastics and PAHs in Urban Runoff can also provide can flag locations that may require closer assessment of environmental or health risk.
Stage 1 Checkpoint. Before moving on, confirm you have:
- a drainage map divided into sub-catchments with documented data quality,
- an understanding of how each sub-catchment responds to rainfall,
- pollution sources and clean areas identified,
- a preliminary pollutant ranking, and
- receiving water sensitivities listed.
If any are missing, fill the gaps before continuing. Document any known trends in urban growth, densification, land-use change, and climate projections for rainfall intensity (WILLEMS et al. 2012). These will matter when you set targets in Stage 2 and size measures in Stage 3.
----> You can directly continue to Stage 2 of the IUWMP Journey or go back to Stage 0 <----
This IUWMP Journey stage is part of seecon's practical interpretation of Annex V of Directive (EU) 2024/3019 within the WATERUN project. It is not official EU guidance. The EU Commission implementing acts on methodologies are due by 2 January 2028 (Art. 5(6)). See the Stage 0 for details on how the four stages were developed.
Guidelines for Statutory Drainage and Wastewater Management Plans (DWMPs)
Directive 2006/7/EC on Bathing Water Quality
Directive 2008/105/EC on Environmental Quality Standards
Storm Water Pollution in the Urban Environment of Genoa, Italy
Review of highway runoff characteristics: comparative analysis and universal implications
Influence of Rainfall and Catchment Characteristics on Urban Stormwater Quality
The use of long-term on-line turbidity measurements for the calculation of urban stormwater pollutant concentrations, loads, pollutographs and intra-event fluxes
Climate change impact assessment on urban rainfall extremes and urban drainage: Methods and shortcomings
Combined Sewer Overflows – Guidance for Long-Term Control Plan (EPA 832-B-95-002)
The foundational guidance for a 30-year track record of Long-Term Control Plans across ~700 US combined-sewer municipalities. Structured into Nine Minimum Controls, system characterisation, alternatives evaluation, selected-controls implementation and post-construction monitoring. Validates the phase-by-phase logic used in Stage 1 and demonstrates what long-term monitoring of outcomes looks like in practice.
US EPA (1995): Combined Sewer Overflows – Guidance for Long-Term Control Plan (EPA 832-B-95-002). Washington, DC: US Environmental Protection Agency, Office of Wastewater Management. URL [Accessed: 06.05.2026] PDFDeliverable 4.5 – Urban Runoff Water Quality Management Plans (URUQ-MAP) for Each Case Study
This document is a research deliverable from the EU-funded STOPUP project focused on managing urban stormwater quality through a risk-based approach, developing tailored water quality management plans for several European case study cities. STOPUP emphasises identifying and mitigating pollution risks at source. The deliverable provides practical frameworks for assessing and controlling contaminants in urban runoff before they reach receiving water bodies.
STOPUP CONSORTIUM (2025): Deliverable 4.5 – Urban Runoff Water Quality Management Plans (URUQ-MAP) for Each Case Study. STOPUP Project, EU Horizon Europe Grant Agreement No. 101060428. Brussels: European Commission. URL [Accessed: 15.04.2026] PDFGenereller Entwässerungsplan (GEP) und Entwässerungskonzept
Concrete municipal example of a Swiss GEP applied to a dense, cross-border urban area. The document illustrates how condition reports across six thematic areas (waters, infiltration, foreign water, sewer network, danger zones, catchments) feed into a binding drainage concept — a useful worked example of Stage 1 outputs translated into municipal planning decisions.
REGIERUNGSRAT BASEL-STADT (2012): Genereller Entwässerungsplan (GEP) und Entwässerungskonzept. Genereller Entwässerungsplan - Zuständigkeiten – Basel. Basel: Amt für Umwelt und Energie. URL [Accessed: 19.04.2026] PDFGestion durable des eaux pluviales : le plan d’action 2022–2024
France’s first national action plan for sustainable stormwater management. 24 actions across four axes: integration into spatial planning, knowledge-sharing and training, enforcement and regulatory tools, and research. Strong emphasis on source-based management, desealing and treating stormwater as a resource — a useful reference for the policy framing of Identify where pollution comes from and the Stage 1 Checkpoint on climate adaptation.
MTECT (2021): Gestion durable des eaux pluviales : le plan d’action 2022–2024. Paris: Ministère de la Transition écologique et de la Cohésion des territoires (MTECT). URL [Accessed: 06.05.2026] PDFGuidelines for Statutory Drainage and Wastewater Management Plans (DWMPs)
UK statutory guidance for water and sewerage companies under section 94 of the Water Industry Act 1991. DWMPs are 25-year strategic plans produced on a 5-year cycle, structured around Strategic and Tactical Planning Units (sub-catchment and wastewater treatment works level). They require climate projections, CSO frequency analysis, WFD linkage and adaptive planning under uncertainty — making them the nearest real-world equivalent to an IUWMP.
DEFRA; ENVIRONMENT AGENCY; OFWAT; WELSH GOVERNMENT & NATURAL RESOURCES WALES (2025): Guidelines for Statutory Drainage and Wastewater Management Plans (DWMPs). London: gov.uk-Environment-Water Management. URL [Accessed: 30.04.2026]Leitfaden GEP 2025 – Generelle Entwässerungsplanung
The current (2025) Swiss national framework for municipal drainage planning, replacing the 2010 Musterpflichtenheft. Every Swiss municipality must maintain a Genereller Entwässerungsplan (GEP) and update it on an 8–10-year cycle. The Leitfaden covers situation analysis, sub-project scoping, data management and an action plan — validating the sub-catchment approach and source-control logic used throughout the IUWMP.
VSA (2025): Leitfaden GEP 2025 – Generelle Entwässerungsplanung. Glattbrugg: Verband Schweizer Abwasser- und Gewässerschutzfachleute (VSA). URL [Accessed: 15.04.2026] PDFProgram Guidance on Combined Sewer Overflow (CSO) Facility Plans (DEPLW0846)
Practitioner-level US state guidance that directly complements the EPA framework. Specifies how to scope CSO facility plans, define monitoring plans (measurement points, minimum durations, sampling protocols), assess system condition and structure a CSO Master Plan. Useful reference for the operational detail behind Map runoff in your city and the rainfall-monitoring recommendations in Stage 1.
ME DEP (1994): Program Guidance on Combined Sewer Overflow (CSO) Facility Plans (DEPLW0846). Augusta, ME DEP: Maine Department of Environmental Protection. URL [Accessed: 22.04.2026] PDFDirective (EU) 2024/3019 on the Treatment of Urban Wastewater (Recast)
Directive (EU) 2024/3019 on the Treatment of Urban Wastewater modernizes the European Union’s framework for urban wastewater management as part of the EU Green Deal and Zero Pollution Action Plan. It introduces stricter requirements for wastewater collection and treatment, including the removal of nutrients, micropollutants, and emerging contaminants, while also promoting energy efficiency, water reuse, and circular economy approaches. The directive strengthens monitoring obligations, addresses stormwater overflows and public health surveillance, and applies the “polluter pays” principle to help finance advanced treatment technologies.
EUROPEAN PARLIAMENT & COUNCIL OF THE EU (2024): https://eur-lex.europa.eu/eli/dir/2024/3019/oj [Accessed: 27.04.2026]