Compiled by: Simon Joncourt, seecon international gmbh
From pollution sources to receiving water risk
Stage 1.5 of the IUWMP requires assessing whether discharges from urban runoff and sewer overflows affect receiving waters and identifying where these impacts justify action. While previous stages identify where pollution is generated (Section 1.3) and which pollutants matter most (Section 1.4), this step focuses on understanding whether these discharges actually pose a risk to human health or ecosystems in their downstream context.
The risk-based DSS supports this analysis by combining hydraulic modelling with quantitative risk assessment. It translates pollutant concentrations at discharge points into measurable indicators of health risk (QMRA) and environmental risk (QCRA), and links these to their receiving waters through spatial analysis.
This sub-factsheet explains how to use DSS outputs to determine whether discharges pose a risk, how to interpret the results, and how to identify priority zones in line with Stage 1.5 requirements.
Workflow
1. Run the baseline risk assessment at discharge points (Section 1.5)
Start from a calibrated SWMM model that simulates flows and pollutant concentrations across the drainage system under representative rainfall conditions. Use these outputs to calculate risk at each discharge point under the current situation, without additional treatment measures. The DSS uses these simulated concentrations as input for both microbial and chemical risk assessment, ensuring that the analysis reflects actual system behaviour under rainfall-driven conditions (SZELĄG et al., 2025).
This baseline reflects how the system performs today and provides the reference for identifying where discharges may pose a risk to receiving waters under rainfall-driven conditions.
2. Interpret microbial risks using QMRA (Section 1.5)
For pathogens, the DSS applies QMRA to estimate health risks associated with exposure to stormwater. This includes pathogens such as Campylobacter, Rotavirus, and Cryptosporidium, with E. coli often used as an indicator organism when direct measurements are not available.
The results are expressed as Disability-Adjusted Life Years (DALYs), following WHO guidance (WHO, 2016) (see Figure 1). DALYs provide a common metric to compare different exposure scenarios, such as irrigation or reuse.
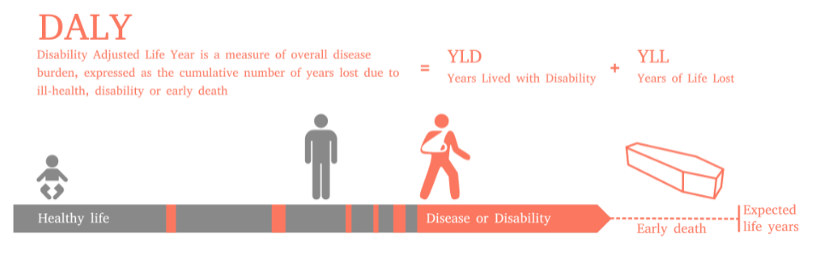
Figure 1. Disability-Adjusted Life Years (DALYs). Source: WHO (2016)
As you can see in Figure 2, interpretation is straightforward: values below 10⁻⁶ DALYs per person per year are considered acceptable, while higher values indicate that the discharge may pose a health risk and requires mitigation. In the Figure, you can see how in most of discharging points the DALYs are below the threshold.
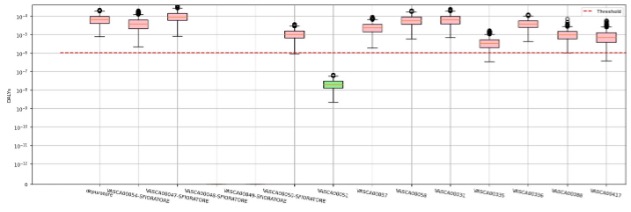
Figure 2. Example of the results obtained by the QMRA tool in the Italian case study, Cupra Marittima. Source: UNIVPM (2023)
This allows you to identify where reuse is safe and where restrictions or treatment are necessary.
3. Interpret chemical risks using QCRA (Section 1.5)
For chemical contaminants such as heavy metals and hydrocarbons, the DSS applies QCRA to assess environmental risk. Simulated concentrations are used to estimate the Predicted Environmental Concentration (PEC) in the receiving water, which is then compared with the Predicted No-Effect Concentration (PNEC).
The resulting risk quotient (RQ = PEC/PNEC) indicates whether ecological thresholds are exceeded. Values below 1 suggest acceptable conditions, while values above 1 indicate potential harm to aquatic organisms and the need for intervention (EUROPEAN COMMISSION, 2003).
This step allows you to link pollutant loads from urban runoff directly to potential impacts on receiving waters, in line with Environmental Quality Standards under EU legislation.
4. Produce the risk map and identify priority discharge points (Section 1.5)
Once risk indicators have been calculated, link them to the georeferenced discharge points in your drainage system and visualise them in GIS. The resulting map shows where risks are acceptable and where they are critical, and how these relate to receiving waters such as rivers, coastal zones, or protected areas.
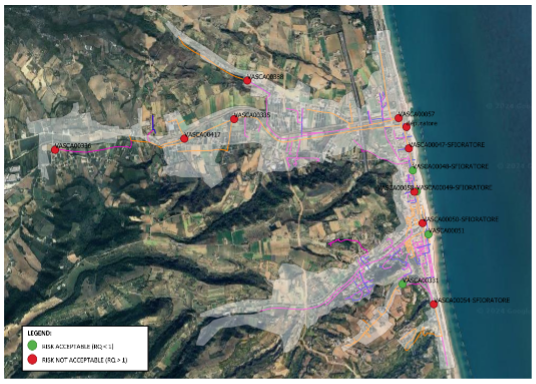
Figure 3. Example of the visualization in GIS in the Italian case study, Cupra Marittima. Source: UNIVPM (2023)
This spatial representation is the core deliverable of Stage 1.5. It allows you to identify priority zones where discharges coincide with sensitive receptors or protected areas, such as bathing waters, Natura 2000 sites, or drinking water zones, and where action is therefore required.
Where risk indicators exceed thresholds and affect sensitive waters, the discharge can be identified as a relevant pressure.
5. Cross-reference risks with pollution sources (Sections 1.3–1.4)
The DSS results should not be interpreted in isolation. Combine the risk map with outputs from CleanCityCover and other tools.
CleanCityCover identifies where pollution is generated, while the DSS shows where that pollution translates into impact. Together, they connect sources to consequences. This makes it possible to distinguish between areas that generate high loads but have limited impact, and those where even moderate loads result in significant risk due to sensitive receiving environments.
This step ensures that priorities in the IUWMP are based on both source intensity and actual impact.
6. Compile the Stage 1.5 deliverables for the IUWMP
At the end of this workflow, translate the DSS results into clear the following IUWMP deliverables:
- Risk map of discharge points. A GIS-based map showing all discharge locations, their associated risk levels (DALYs and/or RQ), and their relationship to receiving waters. This is the core deliverable of Stage 1.5 and demonstrates where impacts occur.
- Risk characterisation at discharge points. A structured table summarising, for each discharge point, the calculated microbial and/or chemical risk indicators, the relevant thresholds (DALYs or RQ), and whether the risk is acceptable or not.
- Priority discharge zones. A list or map identifying discharge points that require attention, based on the combination of risk levels and receiving water sensitivity. This should clearly distinguish between locations where action is needed and those where risk is negligible.
Translate these results into your IUWMP narrative. Stage 1.5 requires demonstrating whether discharges contribute to risk in receiving waters. The DSS provides this evidence directly, but it should be framed in context:
- which receiving waters are affected,
- what type of risk is present, and
- whether this represents a priority pressure for your system.
These outputs feed directly into Stage 2 and Stage 3 of the IUWMP, where priority zones and risk drivers guide decision-making.
What this produces for the IUWMP
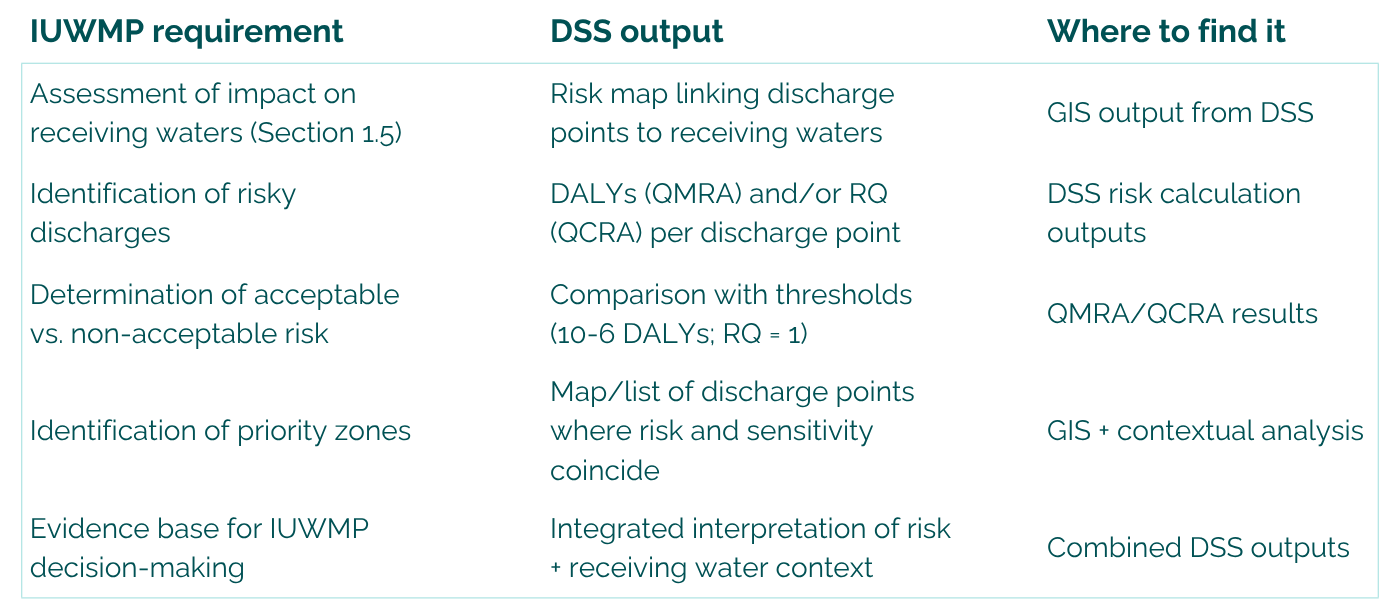
Table 1. What this produces for the IUWMP. Source: OWN ELABORATION (2026)