Tool 4: MUST-B: Management of Urban Stormwater at Block-level
The MUST-B Planning Toolkit is an open-source planning tool that helps cities decide where and how to manage stormwater at its source—before it overwhelms the sewer system. It works at the scale of urban blocks, the areas enclosed by surrounding streets, and uses freely available data to assess how much runoff each block generates, where the greatest pressures lie, and what can realistically be done about them through green infrastructure and Nature-based Solutions.
Rather than requiring expensive surveys or detailed sewer maps, the toolkit generates the information planners need from open datasets—road networks, elevation data, land cover, and rainfall statistics. This makes it usable in cities with good data as well as in cities where infrastructure records are incomplete or unavailable.
Key Outputs include:
- A block-by-block map showing where runoff pressures are highest and where green infrastructure can realistically be placed
[OUTPUT 1 ILLUSTRATION]
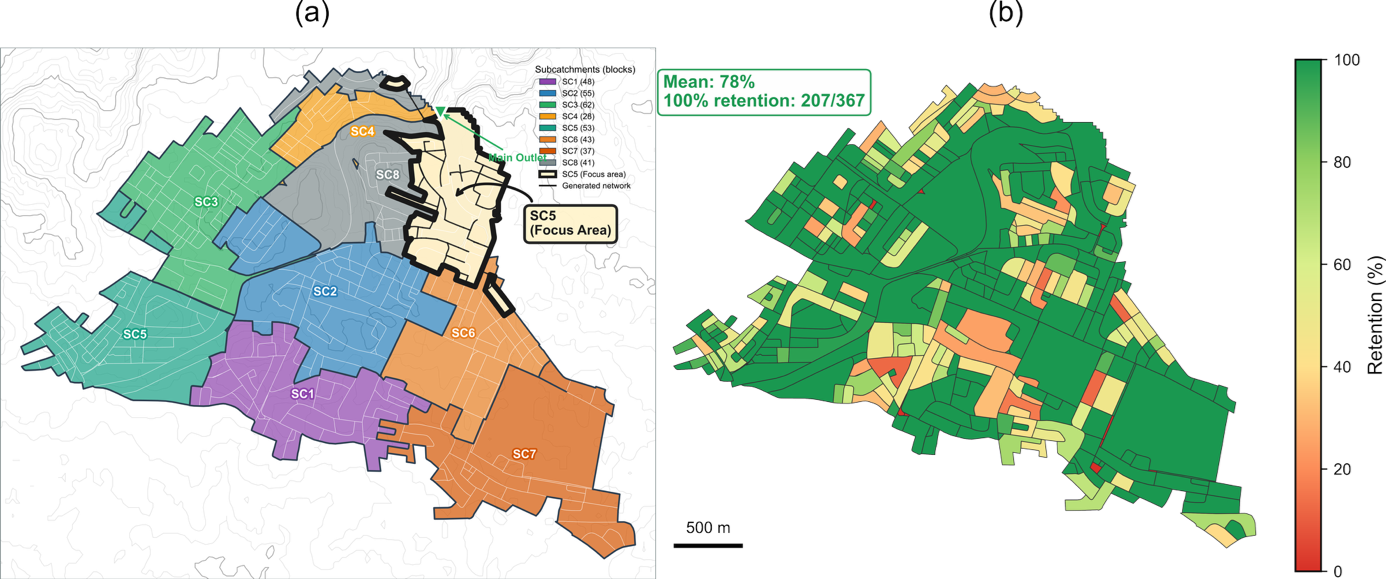
- Planning-level estimates of how much stormwater each block can retain through Nature-based Solutions
[OUTPUT 2 ILLUSTRATION]
- Simulation results showing how these measures reduce overflow and discharge to receiving waters at the catchment scale
[OUTPUT 3 ILLUSTRATION]
- Side-by-side comparison of alternative strategies, including cost–performance trade-offs, to identify where investment is most effective
[OUTPUT 4 ILLUSTRATION]
The toolkit is designed for the early planning stage, when decisions have the greatest influence on long-term outcomes but uncertainty is still high. Instead of producing final engineering designs, it narrows the options, highlights priorities, and helps municipalities focus infrastructure investments where they deliver the most benefit—reducing costs and avoiding oversized or misplaced solutions. (UFZ, 2026a)
How does the tool support the implementation of EU Directive 2024/3019?
The new EU Directive 2024/3019 requires cities to better manage pollution from stormwater and urban runoff. Larger cities must prepare Integrated Urban Wastewater Management Plans (IUWMPs). These plans must analyse existing drainage conditions, set overflow reduction objectives, and define clear measures—with priority given to Nature-based Solutions over conventional grey infrastructure.
The MUST-B Planning Toolkit supports several concrete steps of the Integrated Urban Wastewater Management Plan (IUWMP).
It contributes directly to Stage 1 - Analysis of the initial situation, by providing a block-by-block assessment of runoff generation, imperviousness, and drainage capacity across the urban area, showing where the greatest stormwater pressures lie.
It informs Stage 3 - Selection of measures, by generating and comparing alternative intervention scenarios across different technologies, coverage levels, and storm conditions—including cost–performance trade-offs—so planners can focus investments where they deliver the most benefit. If you want to know more details about the application of the MUST-B Planning Toolkit for Sage 3 – Selection of measure, click on the link below:
Detailed description: Develop and compare scenarios with the MUST-B Planning Toolkit (Applying MUST-B in IUWMP Stage 3)
MUST-B shows which urban blocks generate the most runoff, where green infrastructure has room to work, and which intervention strategies are most cost-effective. By linking spatial analysis to scenario-based planning, the toolkit helps translate IUWMP requirements into actionable, evidence-based decisions—early in the planning process, when strategic choices have the greatest impact.
What you need to apply it
The MUST-B Planning Toolkit runs on open-source software. No proprietary licences are needed.
To apply it in a new city, the following open datasets are required:
- A road network (e.g. from OpenStreetMap) to generate urban block polygons
- A digital elevation model for terrain and flow routing
- Land cover or imperviousness data to estimate sealed and unsealed surfaces
- Population data to support wastewater flow estimation
- Rainfall intensity–duration–frequency curves or design storm events from national meteorological services
Where available, local datasets such as surveyed sewer networks, high-resolution land-use maps, or local cost figures can be integrated to refine results—but they are not mandatory.
Users need basic familiarity with Python, as the toolkit runs through two open-source packages: UrbanWaterBlocks and pysewer. A standard computer with a GIS-capable environment is sufficient. Basic understanding of urban drainage is helpful, but advanced hydraulic modelling expertise is not required.
The toolkit has been applied and tested in three contrasting cities within the WATERUN project: Santiago de Compostela (Spain), Aarhus (Denmark), and Amman (Jordan). Beyond the project, the toolkit is already being used in practice: the city of Halle (Germany) has commissioned consulting services based on MUST-B to develop a strategic approach for promoting blue-green infrastructure, and the Helmholtz Research Centre is using it to assess the potential of blue-green infrastructure on its campus premises. Further requests are currently being processed. For new cities, setup mainly involves collecting the open datasets listed above and adapting rainfall inputs to local conditions. The modular structure means it can be scaled from a single neighbourhood to an entire city.
Even with imperfect or incomplete data, the toolkit can still identify priority areas, compare intervention strategies, and highlight where more detailed investigation is needed. Because it helps focus investments on the areas and strategies that matter most, it can reduce unnecessary spending and avoid oversized or misplaced solutions. (UFZ, 2026b)
Cost
[TO BE ADDED LATER]
Limitations / Scope
What the tool does not do
The toolkit identifies where to act and what to prioritise. It does not produce construction-ready designs, final pipe dimensions, or permit-ready documentation. Where a specific bioretention cell needs to be designed or a sewer section needs to be verified against local standards, conventional engineering tools and site investigations are still needed.
Operational details—such as real-time control systems, pump stations, or complex throttle rules—are represented only in simplified form. The toolkit captures their broad effect on system behaviour, not their precise mechanics.
Water quality is addressed indirectly. The toolkit estimates how much runoff can be retained at source, which serves as a proxy for reducing pollution loads. It does not model pollutant concentrations, treatment processes, or impacts on receiving water quality.
The toolkit works with physical space—not with ownership, regulations, or public acceptance. It can show where green infrastructure could fit based on available land, but whether it can actually be built there depends on decisions that go beyond spatial analysis.
Results are approximate by design. The toolkit is built for the stage of planning where uncertainty is high but strategic choices matter most. Outputs depend on the quality of input data, on simplifications in how sewer networks and urban blocks are represented, and—in retrofit situations—on assumptions about how much impervious runoff can realistically be routed to green infrastructure. The most reliable insights come from comparing scenarios side by side and looking for consistent spatial patterns, not from interpreting any single number in isolation.
The toolkit is fully open-source, publicly accessible, and ready to use. No proprietary software is required. The accompanying manual (WATERUN Deliverable D3.4) provides step-by-step guidance for applying the toolkit to new cities. Users with basic Python and GIS skills can get started using the open datasets described in this factsheet. As with any planning-level tool, detailed design and regulatory compliance require follow-up with local expertise and conventional engineering methods. (UFZ, 2026b)
User Guide – How to Use the Tool in Practice
The MUST-B Planning Toolkit follows a step-by-step workflow that moves from data collection to scenario comparison. Some preparation is required before running the toolkit. You will need open datasets describing your study area: a road network, a digital elevation model, land cover or imperviousness data, population data, and rainfall intensity–duration–frequency curves. Where available, local datasets such as surveyed sewer networks or high-resolution land-use maps can be added to refine results. This preparation ensures that outputs reflect local conditions.
Once the data are ready, the workflow is straightforward. To move from data to actionable planning insights, follow these steps:
Step 1 – Define your study area
Set a city or catchment boundary and collect the required open datasets. Choose the design storms you want to test based on local rainfall statistics and your planning objectives.
Step 2 – Generate urban blocks
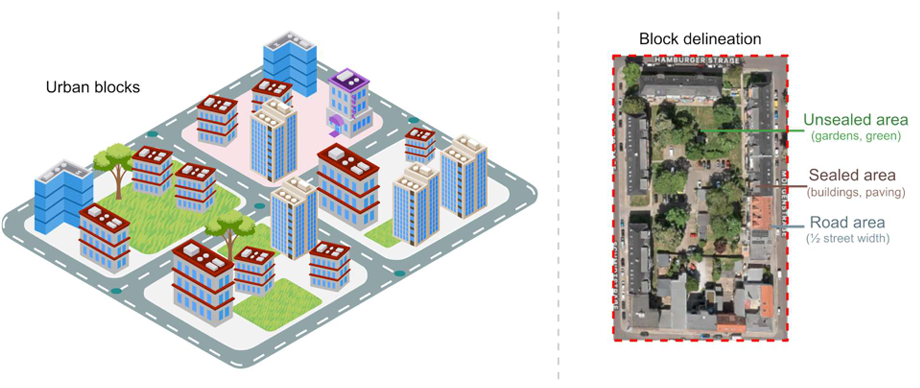
The toolkit converts the road network into closed polygons—urban blocks—that serve as the basic spatial units for all subsequent analysis. Existing block geometries from local GIS sources can also be imported directly.
Step 3 – Map block attributes
Each block is enriched with key characteristics: sealed and unsealed surface fractions, population estimates, and the available space for placing green infrastructure. The toolkit also identifies the largest connected green area within each block as the potential space for placing Nature-based Solutions.
Step 4 – Pre-size green infrastructure
For each block, the toolkit estimates how much runoff is generated during a design storm and calculates the size of bioretention cell or infiltration shaft needed to retain it. Where space is limited, partial retention is quantified. Repeat this step for different storm severities to compare performance.
Step 5 – Generate a drainage network
If surveyed sewer data are unavailable, the toolkit generates a synthetic gravity-driven network using block geometry, street layout, and elevation data. The user first selects the type of sewer system to represent—combined, separate stormwater, or sanitary—and defines one or more outlet points. The toolkit then routes flows toward these outlets, enforces gravity-driven flow based on terrain, and sizes pipes to handle the expected runoff. If surveyed sewer data are available, they can be used directly and this generation step is not needed.
Step 6 – Simulate downstream effects
The toolkit assembles a hydraulic model by linking block-scale runoff and green infrastructure definitions to the drainage network. This model is then simulated dynamically using EPA SWMM. Results show how block-scale interventions affect combined sewer overflows, stormwater discharge to receiving waters, and network flooding compared to a baseline without intervention. The toolkit also provides indicators to check that the simulation ran reliably before results are interpreted.
Step 7 – Compare scenarios and set priorities
Results are compared using planning-level indicators: runoff retained at source, overflow reduction, network stress, and cost per volume reduced. Identify which blocks and strategies deliver the most benefit, where returns diminish, and where more detailed investigation is needed.
The workflow is modular. Users interested only in block-scale screening can stop after Step 4. Those who need to understand downstream effects continue through Steps 5–7. In all cases, results are intended for strategic planning and prioritisation—not for final engineering design.
By following these steps, the MUST-B Planning Toolkit turns open data into a clear spatial picture of where to act, what to invest in, and what to investigate further. For best results, it can be used together with pollution source identification tools such as CleanCityCover and risk-based decision support tools developed within the WATERUN project. (UFZ, 2026b)
What Decisions Does the Tool Enable?
The MUST-B Planning Toolkit supports decisions at three levels: screening, investment, and strategic planning.
At a screening level, it helps planners identify where to focus attention. Instead of treating every neighbourhood the same, teams can see which urban blocks generate the most runoff, where green infrastructure has room to work, and where drainage capacity is under the greatest pressure.
At an investment level, the toolkit supports evidence-based prioritisation. It helps answer questions such as:
- Where will Nature-based Solutions deliver the greatest runoff or overflow reduction?
- Which areas can be addressed with decentralised measures, and where is additional infrastructure needed?
- At what point does further investment stop delivering meaningful returns?
- How can we justify spending decisions with transparent, scenario-based evidence?
At a strategic level, the MUST-B Planning Toolkit supports long-term urban water management planning. It provides a structured way to compare alternative intervention strategies, assess the realistic potential and limits of decentralised approaches, and identify where overflow reduction targets may be difficult to meet. By testing different storm severities and coverage levels, it also supports climate-robust decision-making and reduces the risk of over- or under-designing interventions.
For municipal decision-makers, this means clearer spatial priorities, more defensible investment decisions, and stronger alignment with EU requirements for integrated urban wastewater management. (UFZ, 2026a)
Case Studies
The MUST-B Planning Toolkit has been applied in three contrasting cities within the WATERUN project. Each case study tests the toolkit under different urban conditions, drainage systems, and data availability—demonstrating its flexibility and transferability.
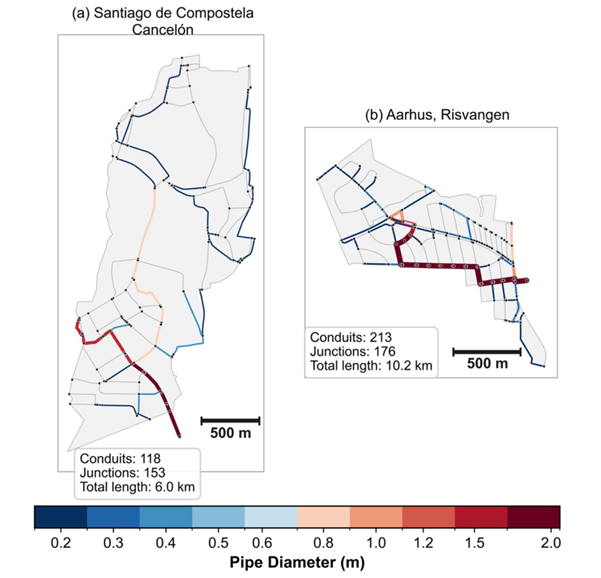
Santiago de Compostela, Spain – Reducing combined sewer overflows in a historic city

Santiago de Compostela is a dense, historic city with a combined sewer system that is prone to overflow during intense rainfall. As a UNESCO World Heritage site, space for conventional infrastructure upgrades is extremely limited, making decentralised green infrastructure particularly relevant.
The toolkit was applied to the Cancelón catchment to explore how much combined sewer overflow (CSO) can be reduced through block-scale Nature-based Solutions. Importantly, surveyed sewer data were available but intentionally not used—to test whether the data-reduced approach could reproduce key system dynamics at planning scale.
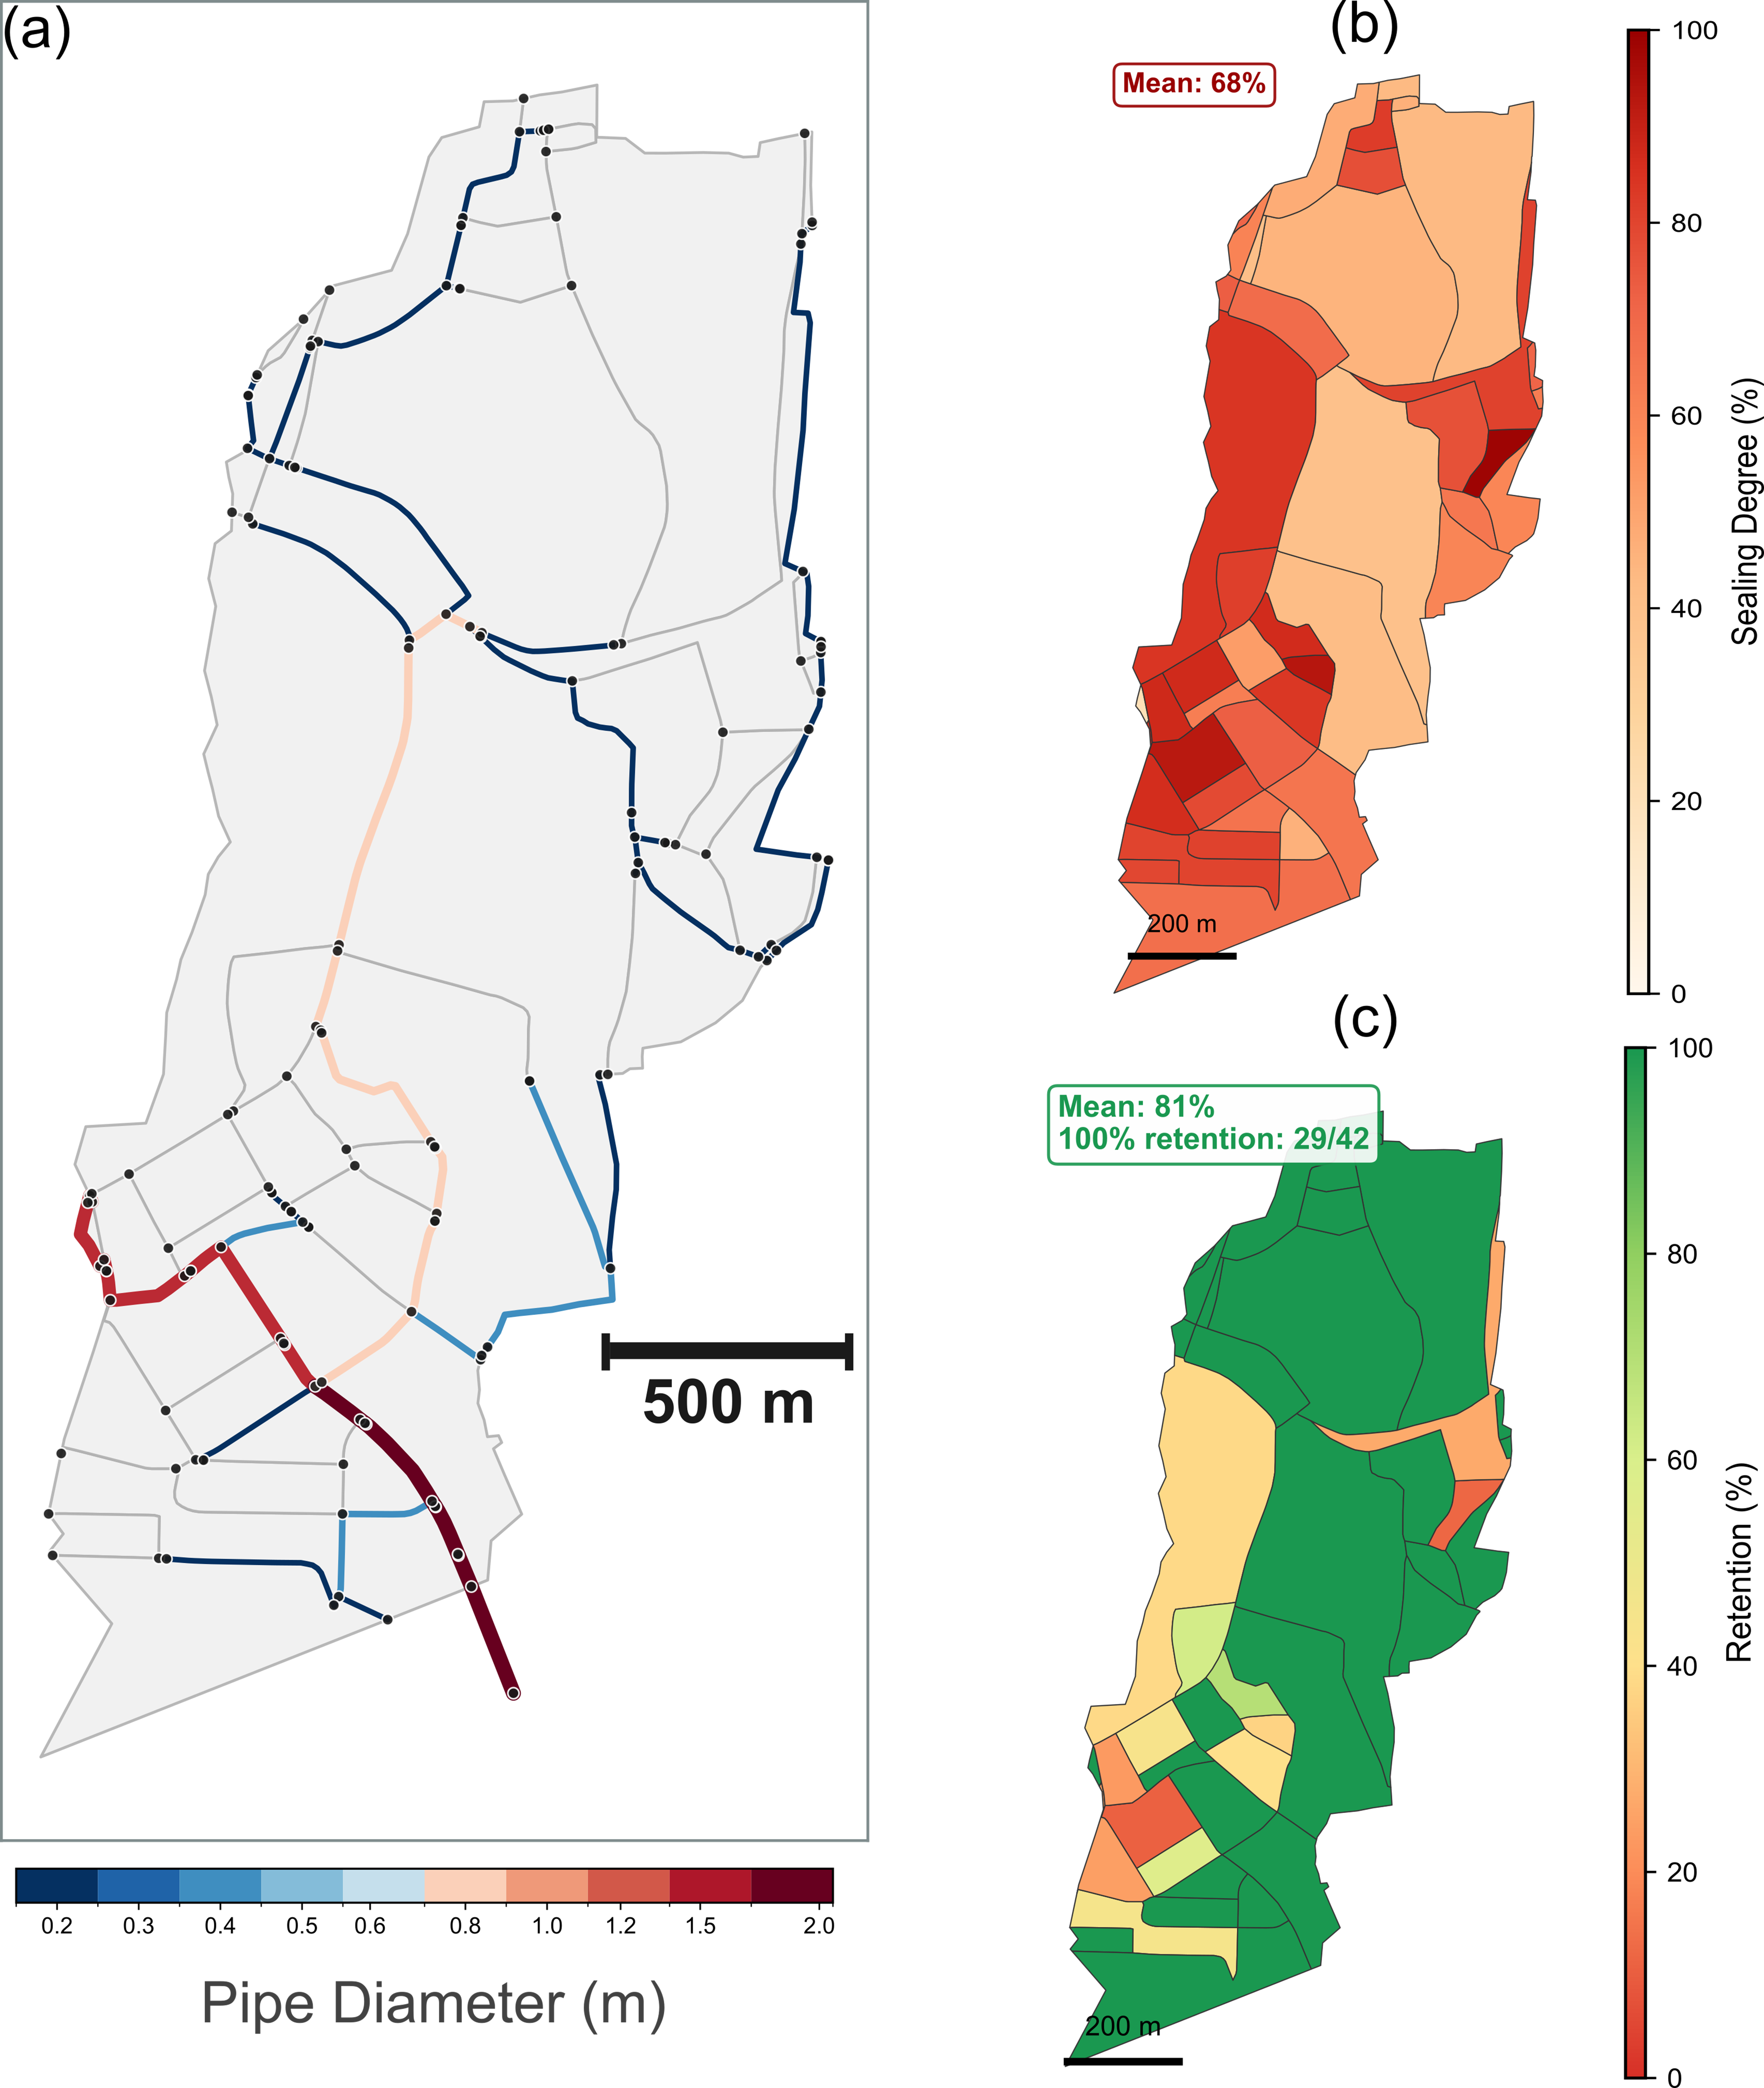
Results showed that:
- Substantial CSO reductions can be achieved through decentralised interventions, even when only a fraction of available green space is used
- The fraction of impervious runoff actually routed to green infrastructure—the connectivity parameter—matters more than the size of the measures themselves
- The synthetic network and block-based modelling reproduced observed system behaviour with good accuracy, confirming the approach is suitable for early-stage planning
This case demonstrates the value of the toolkit for screening feasible CSO mitigation strategies in complex, space-constrained urban environments. (UFZ, 2026a)
Find more information on the Santiago de Compostela Case study here: [LINK TO SANTIAGO CASE STUDY]
Aarhus, Denmark – Reducing stormwater discharge to sensitive receiving waters

Aarhus (Risvangen district) is a well-developed urban area served by a separate stormwater system designed to convey runoff safely to the Bay of Aarhus. The existing system already performs well for flood protection. The question here was not whether the system works, but whether decentralised measures can deliver additional benefits—specifically, reducing stormwater discharge and associated pollution loads to sensitive receiving waters.
In consultation with the local utility Aarhus Vand, infiltration-based solutions were considered unsuitable due to high groundwater levels and local soil conditions. The analysis therefore focused on retention-based measures.
The toolkit was used to run two modelling experiments:
- Experiment 1 – Retrofit: Adding block-scale green infrastructure to the existing drainage system to evaluate additional discharge reductions
- Experiment 2 – Integrated design: Exploring how green infrastructure deployment influences the required size of the conveyance network itself
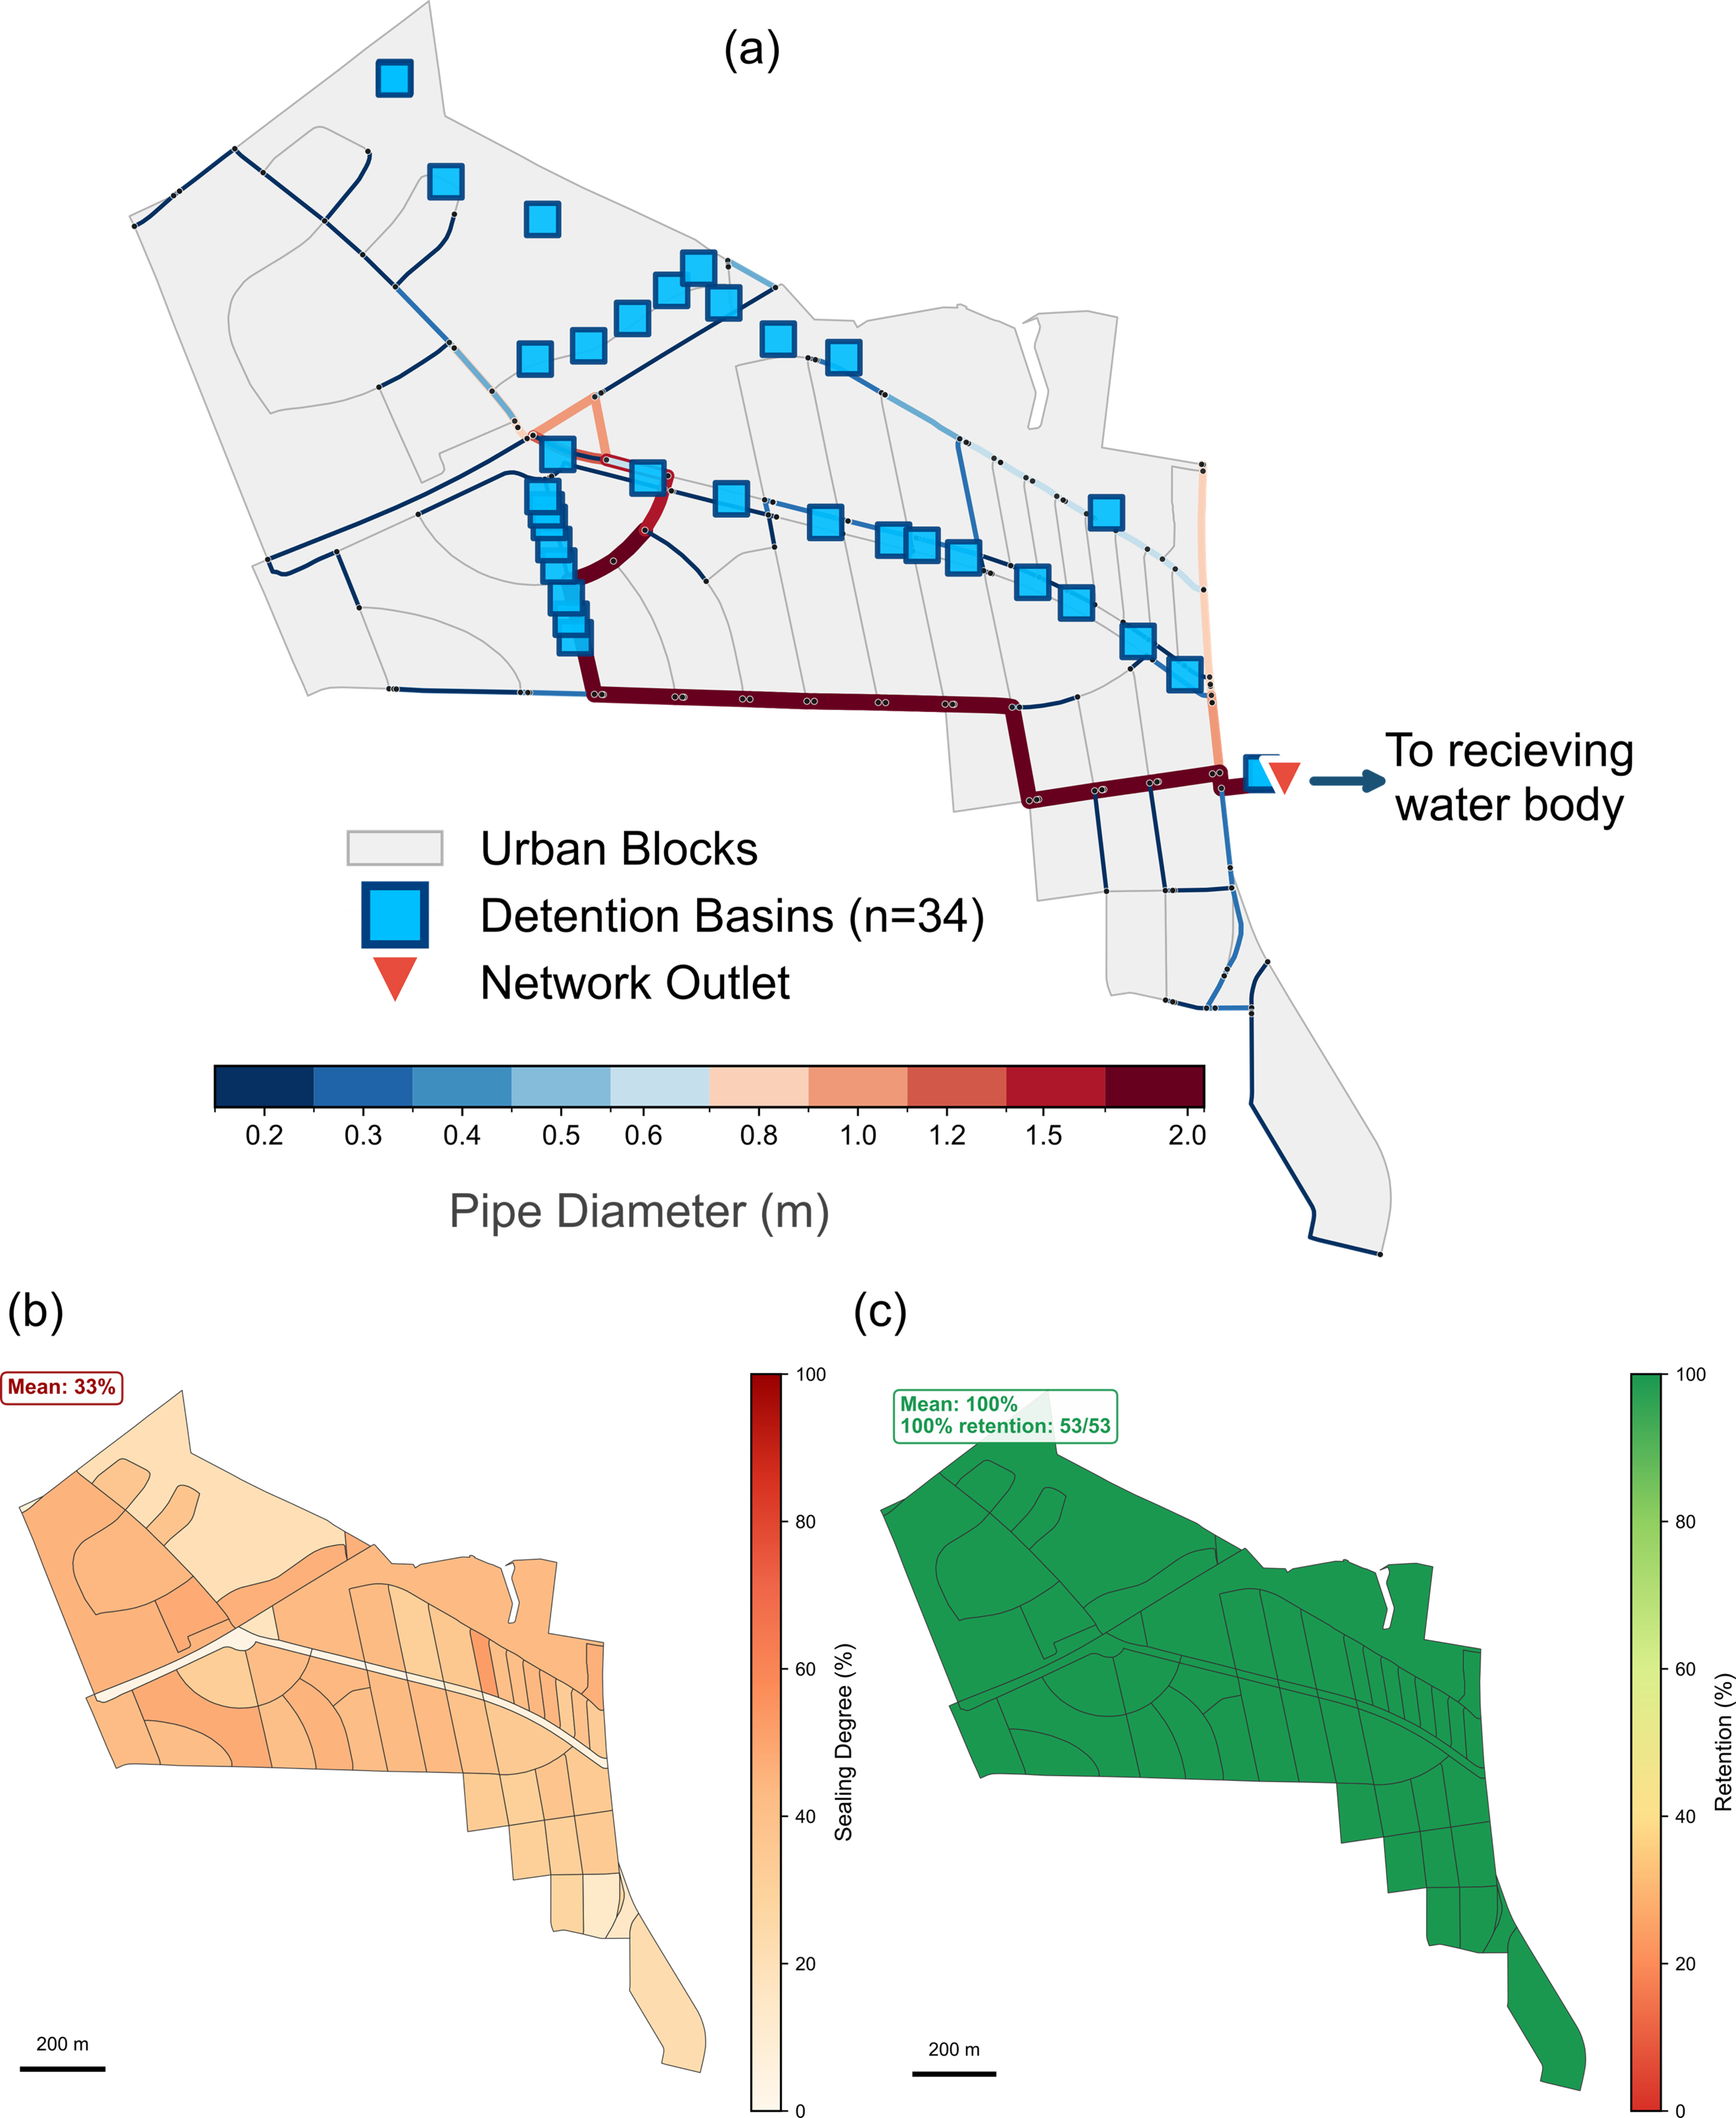
Results showed that:
- Decentralised retention measures can significantly reduce downstream discharge, even in a well-functioning system
- Cost–performance trade-off analysis identified efficient solution ranges, helping planners see where additional investment still delivers meaningful benefit—and where it no longer does
This case highlights how the toolkit supports strategic decisions even in cities where the drainage system is already well adapted. (UFZ, 2026a)
Find more information on the Aarhus Case study here: [LINK TO AARHUS CASE STUDY]
Amman, Jordan – Managing flash flood risk in a data-scarce, steep urban environment

Amman (Al-Zuhour catchment) is a steep, topographically complex urban area where intense rainfall generates rapid runoff and flash flooding. The city has recently invested in downstream infrastructure—a 2,100 m³ underground detention tank and a 750 m³ bioretention system—to provide flood relief at the Al-Zuhour Triangle. Despite these measures, the catchment remains hydraulically challenging due to strong elevation gradients and fast flow concentration.
The toolkit was applied to evaluate how decentralised block-scale interventions can supplement the existing infrastructure and reduce runoff pressures upstream. The analysis required specific adaptations for the steep terrain, including hierarchical subdivision of the catchment into smaller hydraulic units and special handling of uphill flow conditions.
Results showed that:
- The existing downstream infrastructure fills to capacity for all design storms, handling 66–96% of catchment runoff with zero overflow—but 4–34% of runoff is lost to surface flooding upstream before it reaches the facility
- A small number of blocks dominate runoff contributions, making targeted interventions far more effective than uniform implementation across the catchment
- Block-scale green infrastructure significantly reduces both surface flooding and downstream discharge, even with simplified network configurations
- This case demonstrates that the toolkit can be applied effectively in data-scarce and topographically challenging environments, identifying where decentralised measures provide the greatest added value to existing infrastructure. (UFZ, 2026a)
Find more information on the Amman Case study here: [LINK TO AMMAN CASE STUDY]
Contact Information
The MUST-B Planning Toolkit was developed by the Helmholtz Centre for Environmental Research – UFZ, Leipzig, Germany, as part of the EU-funded WATERUN project. The toolkit is maintained by the Working Group on Water Sensitive Infrastructure Planning within the Department of Systemic Environmental Biotechnology.
For questions about the toolkit, its application, or potential collaboration, the development team can be contacted directly:
- UFZ Stadtbüro: stadtbuero@ufz.de