

Executive Summary
Financial Management is a vital task for every company and should always draw the attention of an entrepreneur. This factsheet covers three distinct and important methods to keep a company’s financial activities and future in line: the basic accounting methods of profit and loss (P&L) statement and the balance sheet. Thirdly, it explains how liquidity planning works, a task which each entrepreneur should do on a daily basis — because it breaks company’s necks fast and swift, regardless of it making profits or losses.
Liquidity Planning
Liquidity planning or cash management means nothing less than ensuring that a company remains solvent at all times for the foreseeable future. Liquidity planning also gives you an overview of how much free liquidity can be managed in the short, medium, and long term (CREDIT SUISSE 2014).
Liquidity planning can spell the difference between success and failure. It is entirely possible for a business to earn a profit and still go out of business by running out of cash. Cash management involves forecasting, collecting, disbursing, investing, and planning for the cash. It is a vital task, as businesses fail because they’re insolvent. More companies fail for a lack of cash rather than for a lack of profit!
Cash Flow Cycle
The first thing in liquidity planning is to understand the company’s cash flow cycle: the time lag between paying suppliers for merchandise or materials and receiving payment from customers for the product or service. The longer the cash flow cycle, the more likely it is that the business owner will encounter a cash crisis. On a daily basis, business owners should generate or update a report showing the following items: total cash on hand, bank balance, summary of the day’s sales, summary of the day’s cash receipts, summary of the day’s cash disbursements, and a summary of accounts receivable collections.
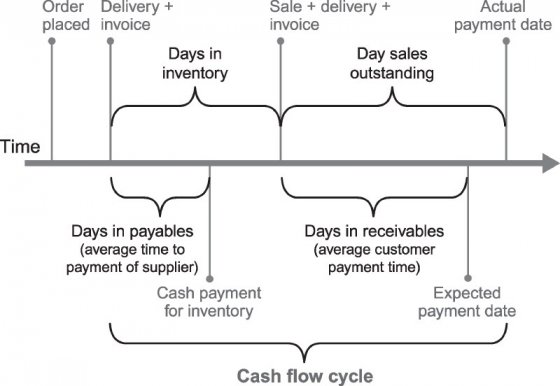
Representation of the cash flow cycle. Source: WEISS (2014)
The next step in effective liquidity planning is to analyse the cash flow cycle, looking for ways to reduce its length. This can be achieved by either reducing the time of the product in inventory, or by reducing the days in receivables, e.g. by billing promptly and offering discounts for fast payments.
Preparing a Liquidity Plan
Typically, small business owners should prepare a projected monthly liquidity plan or cash budget for at least one year into the future and quarterly estimates for another. The more a firm’s sales pattern varies, the shorter should be its planning horizon, up to a weekly cash budget. A liquidity plan is nothing more than a forecast of the firm’s cash inflows and outflows for a specific time period, and it will never be completely accurate. Cash receipts and cash disbursements are recorded only when the cash transaction is expected to take place.
Formats for preparing a cash budget vary depending on the pattern of a company’s cash flow. Each monthly column should be divided into two sections — estimated and actual — so that each succeeding cash forecast can be updated accordingly. Templates are abundant on the web and found embedded in many spreadsheet calculators such as Microsoft Excel.
There are five basic steps in completing a cash budget:
- Determining an adequate minimum cash balance. How big should your cash cushion be to cover unexpected costs?
- Forecasting sales. Don’t be excessively optimistic in projecting sales.
- Forecasting cash receipts. Account for the delay between the sale and the actual collection of the proceeds.
- Forecasting cash disbursements. Record them in the month in which they will be paid, not when the obligation is incurred. For start-ups it is recommended to add another 10 to 25 per cent of the total to avoid bankruptcy.
- Determining the end-of-month cash balance. The cash on hand, adding total cash receipts and subtracting total cash disbursements. A pattern of cash decreases should alert the owner that the business is approaching a cash crisis.
Subscribe here to the new Sanitation and Water Entrepreneurship Pact (SWEP) newsletter. SWEP is a network of organizations joining hands to help entrepreneurs design and develop lasting water and sanitation businesses.
Profit and Loss Statement
(Adapted from ZIMMERER et al. (2011) and STEVEDAVIES (2008))
The profit and loss statement (P&L) compares expenses against revenue over a certain period of time to show the firm’s net profit (or loss). The P&L is a “moving picture” of a firm’s profitability over time. To calculate net profit or loss, an entrepreneur records all income that flows into the company (sale revenues, rent, investments, interest) and subtracts the various expenses (cost of sales, salary, other expenses). Be sure to visibly include the period of time on the income statement!
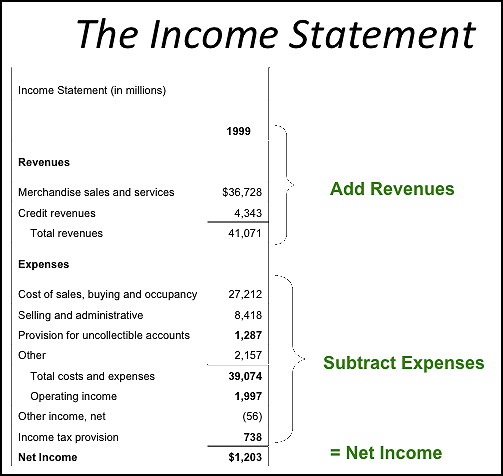
Schematic overview of the income statement or profit and loss statement. Source: GOGREENPLUS.ORG (2013)
Cost of sales or cost of goods sold typically does’t occur for service-providing companies. Manufacturers, wholesalers and retailers however calculate the cost of goods sold by adding purchases to beginning inventory and subtracting ending inventory.
Gross Margin and Gross Margin Ratio
The gross margin or gross profit is an important indicator in any business, and entrepreneurs should watch it closely. If a company’s gross margin ratio slips too low, it is likely that it will operate at a loss. Many people fail to measure it, partly because it’s different for various sector industries (see below). The payoff from creating this measurement for the business is that it tells you how much you are generating from revenues to cover overhead expenses. Knowing your gross margin will give you information in raising prices and cutting expenses. Once the gross profit is known, one can calculate the margin by dividing the gross profit by net sales revenue.
One key thing to remember is that it is perfectly acceptable to use “guestimates” when allocation is difficult. Nobody is going to audit these numbers and they are for your benefit only. If an allocation number is 10% out, it is better than not having it at all.
Gross Margin Calculations for Product Sales
In a business that resells or distributes products, the gross margin calculation is simple. It is calculated by taking revenues and subtracting the costs of goods sold. Any shipping costs incurred in connection with the sale (both inbound and outbound) should be included in the calculation and the revenue side should include any shipping charges levied.
The gross margin and gross margin percentage calculation is as follows:
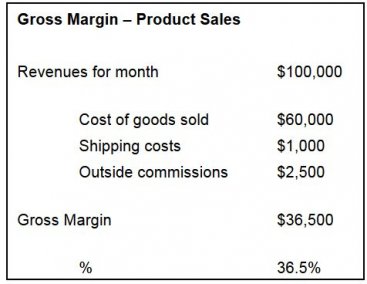
An example of a standard gross margin calculation for a company selling products. Source: STEVEDAVIES (2008)
Gross Margin for Manufacturing
The Gross Margin in manufacturing businesses follows the same principle, with cost of raw materials replacing the cost of goods sold in the previous example. In addition, direct labour costs should be brought into the equation.
Direct labour costs are all those costs directly associated with producing the product. In line with the main definition, they should be included if they are costs that would go away if the product to which they directly relate was not being manufactured. It does not matter whether the employees are salaried or hourly paid, their entire cost should be recorded here. If you are not utilising them fully, then that will start to show up in the gross margin percentage.
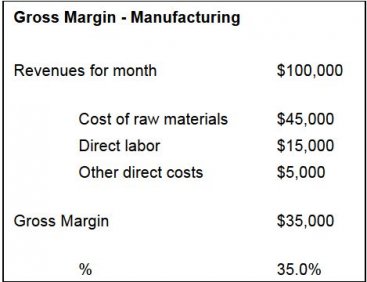
A gross margin calculation for a manufacturing company. Note that the cost of raw materials is by far the highest. Source: STEVEDAVIES (2008)
Gross Margin for Service Companies
The gross margin for a service company can be difficult to put together, but it is an absolutely essential number to measure and to manage.
The cost of goods used is typically quite small as a percentage of revenues – spare parts or incidental expenses – and it is meaningless to look at the business and think that it has a 90% or better Gross Margin as it tells you effectively nothing.
The largest expense component in most service companies is the payroll of the people providing the service. In putting together the Gross Margin calculation it is important to go back to the definition shown earlier and include all the costs that would go away if the service that produces the revenues was not being performed. This includes not only payroll and associated fringe costs but also travel, entertainment and training costs for those personnel.
The template for a Gross Margin in a service company looks like this:
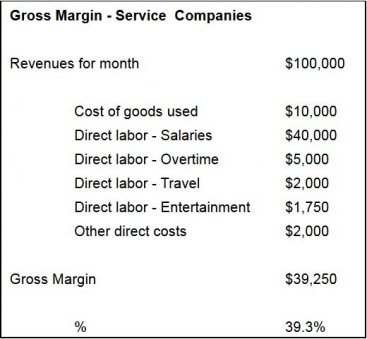
An example of a gross margin calculation for a service company. Note that the material costs are very low. Source: STEVEDAVIES (2008)
Balance Sheet
The balance sheet takes a “snapshot” of a business’s financial position, providing owners with an estimate of its worth on a given date. Its two major sections show the assets that the business owns and the claims creditors and owners have against those assets. It provides a baseline from which to measure future changes.
The balance sheet is built on the fundamental equation: Assets = Liabilities + Owner’s equity. Any increase or decrease on one side of the equation must be offset by an increase or a decrease on the other side (hence the name balance sheet). The balancing factor is the owner’s equity, the value of the owner’s investment in the business.
Assets
The first, left section of the balance sheet lists the company’s assets and shows the total value of everything the business owns. Current assets consist of cash and items to be converted into cash within one year or the normal operating cycle (of production and sales), whichever is longer. Fixed assets are those acquired for long-term use in the business (e.g. of production).
Liabilities
The second, right section shows the business’s liabilities, the creditors’ claims against the assets. Current liabilities are those debts that must be paid within one year or within the normal operating cycle, whichever is longer. Long-term liabilities are those that come due after one year (e.g. mortgage). Owner’s equity or shareholder’s equity is the balancing factor and represents all of the owner’s capital contribution to the business plus all accumulated earnings not distributed to the owner(s).
Net Fixed Assets Definition and Examples
Analyse Liquidity
The analysis of your company's current liquidity situation is important for deciding how to invest your available liquidity. This link shows you how to conduct an analysis as part of your financial planning.
CREDIT SUISSE (2014): Analyse Liquidity. Obtain an up-to-date overview of your company’s liquidity situation. Zurich: Credit Suisse AG URL [Accessed: 11.12.2015]Financial Statements
An overview of four financial statements, including income statement, balance sheet and cash flow statement with examples.
GOGREENPLUS.ORG (2013): Financial Statements. Durham, NC: Institute for Sustainable Development URL [Accessed: 10.12.2015]Key Performance Indicators
A description of gross margin calculations with examples.
STEVEDAVIES (2015): Key Performance Indicators. Huntington, NY: Steve Davies URL [Accessed: 11.12.2015]How to Better Manage your Financial Supply Chain
An overview of financial supply chain management, providing definitions and further readings.
WEISS, J.B. 2014 (2014): How to Better Manage your Financial Supply Chain. London, UK: QFINANCE URL [Accessed: 11.12.2015]Essentials of entrepreneurship and Small Business Management
Business Builder 2. How to Prepare and Analyze a Balance Sheet
This document helps you to examine the concepts of assets, liabilities and net worth in order to relate them to your business. This edition teaches you how to create a balance sheet.
ZIONS BANK (2005): Business Builder 2. How to Prepare and Analyze a Balance Sheet. In: Zions Business Resource Center: URL [Accessed: 11.12.2015]Business Builder 3. How to Prepare a Profit and Loss (Income) Statement
This publication informs you about the purpose of a profit and loss statement (P&L), and gives you advice on how to prepare a P&L statement. It also provides a short checklist.
ZIONS BANK (2005): Business Builder 3. How to Prepare a Profit and Loss (Income) Statement. In: Zions Business Resource Center: URL [Accessed: 11.12.2015]Business Builder 4. How to Prepare a Cash Flow Statement
Before handling a cash budget yourself you should understand the cash flow in your company. This report gives an overview over cash flow and the components in a cash flow statement. Further, it gives you advice on how to prepare a cash flow statement, as well as explaining two methods for constructing the statement. It closes with a chapter on analysing a cash flow statement.
ZIONS BANK (2005): Business Builder 4. How to Prepare a Cash Flow Statement. In: Zions Business Resource Center: URL [Accessed: 11.12.2015]Business Builder 5. How to Prepare a Cash Budget
This pdf outlines the purpose of a cash budget or liquidity plan, and is a guide on creating and analysing a cash budget yourself. It also contains a checklist for your liquidity plan.
ZIONS BANK (2005): Business Builder 5. How to Prepare a Cash Budget. In: Zions Business Resource Center: URL [Accessed: 11.12.2015]http://www.bizfilings.com
The Business Owner’s Toolkit is a comprehensive source for business knowledge. In a chapter it covers all the aspects of financing a (prospective) business owner should know. Further chapters of the Toolkit are “Start-Ups”, “Running a Business”, “Marketing”, and “Office & HR”.