Executive Summary
Data is the lifeblood of decision-making and the raw material for ensuring accountability. Investment and Operation & Maintenance (O&M) decisions must be based on evidence to allow for effective allocation of resources and better Water Sanitation and Hygiene (WASH) and Water Resources Management (WRM). All too often however, unlimited quantities of data are produced without thoroughly thinking about their purpose and taking the decision-maker into account. This has even increased with the data revolution due to the exponential spread of mobile technology and sensor-enabled objects. Data is only as valuable as the decision it enables and data collection, processing and analysis thus have to target the decisions they support.
This factsheet provides a 7-step-framework (or ‘navigator manual’) to guide the management of decision-making processes from defining a need for data to using it for creating an impact. It puts the emphasis on understanding the decision-makers, the decisions at stake and their data needs first, and only then build a decision-making process and select the corresponding tools for collection, analysis and dissemination of the data.
Description of the approach
Data for priority-focused and targeted decision-making
According to the World Bank the lack of WASH services is not a lack of money or technology, but the ineffective allocation of resources. Investment and Operation & Maintenance (O&M) decisions must be based on robust evidence to allow for effective allocation of resources. Without adequate data providing the right information at the right place and time, evidence-based decision-making for better Water, Sanitation and Hygiene services (WASH) or Water Resources Management (WRM) is impossible.
The intention of monitoring should not be to produce unlimited quantities of data for the sake of data collection alone. Data should be collected and processed to inform decision-making – in line with the development objectives a country or organization has set itself. If an NGO conducts household surveys to inform national budget planning, and they focus on indicators like ‘number of toilets’, then no knowledge can be established on the ‘functionality’ or ‘use’ of the toilets. Data collection is thus only one step towards priority-focused and targeted decision-making for better WASH and WRM. Therefore, data collection, processing and analysis need to target the decisions they should enable.
Towards leveraging an inclusive data revolution
Although the spread of mobile technology and sensor-enabled objects has caused an exponential increase in the amount and variety of data and data sources, data-based decision-making processes are hardly established and decision-makers are left with high rates of errors or guessing, resulting in ineffective investments or poor O&M. In addition, huge gaps remain between the data haves and have-nots and the data-literate and data-illiterate and many developing countries are lagging behind when it comes to investing, training and experimenting with data. As a consequence, many citizens and their livelihoods are still unaccounted for and essential environmental parameters are not monitored. (Source: IEAG 2014)
The opportunities of the data revolution can only be exploited to serve the greater goal of improved WASH and WRM if these gaps are closed and inclusive decision-making processes are established. Actively managing the process from raw data into actionable information and improving its enabling environment are key to ensure an inclusive data revolution (Source: OPEN DATA WATCH & DATA2X n.y.).
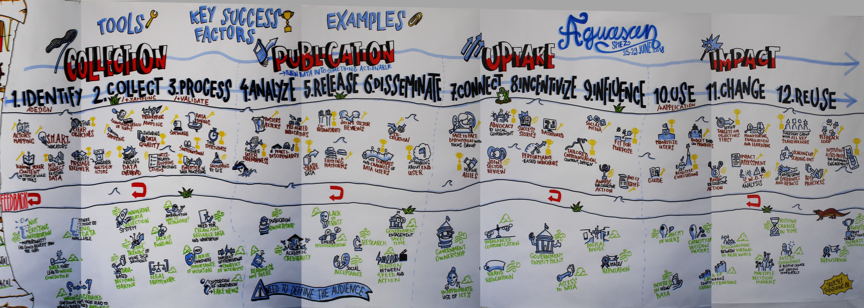
This factsheet provides a 7-step-framework (or ‘navigator manual’) to guide the management of decision-making processes from defining a need for data to using it for creating an impact. It provides key success factors for each step, tools to facilitate the process and examples of data-based decision-making processes for investment and O&M decisions. The framework was developed by the participants of the AGUASAN Workshop “Leveraging the data revolution – Informed decision-making for better water and sanitation management” in June 2018 (see photo below) and adapted for this factsheet.n.y.).
| What is AGUASAN? AGUASAN, the convening body of the workshop is an interdisciplinary Swiss Community of Practice (CoP) that has brought together a broad range of specialists to promote wider and deeper understanding of key water and sanitation management issues in developing and transitioning countries since 1984. The annual five-days AGUASAN Workshop gathers water and sanitation specialists as well as other development practitioners from all over the world to collectively reflect on a cutting-edge topic of the water sector. The workshops provide a joint learning experience and utilise the broad knowledge gathered by the participants to elaborate strategies and conceptual tools of practical use for development work. The Steering Committee is made up of the following organisations: Swiss Agency for Development and Cooperation (Global Programme Water and Humanitarian Aid), Eawag/Sandec, Helvetas, Skat Consulting and seecon. |
7 steps to managing a data-based decision-making process
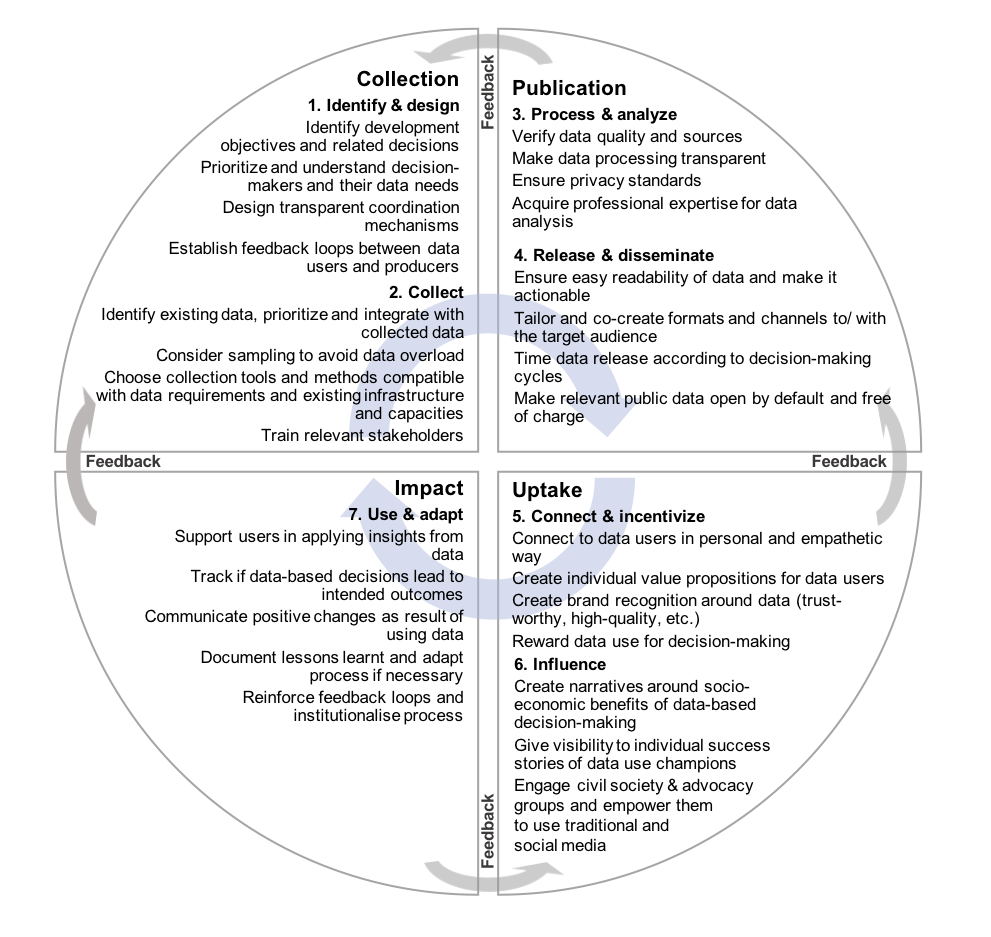
Collection
The first stage of the process is collection. This phase focuses on asking what kind of data is needed to inform a decision for monitoring O&M or making investments. This phase starts with identifying the decision-makers and the type of information they need, the data to be collected and how it is being used. Then a process for collecting the data is established. The last phase of data collection is to ensure that the data is correctly recorded, classified and stored in formats that allow for further use.
Step 1: Identify & design - Consult with decision-makers and determine data needs and data use.
Before data can be collected it is essential to identify the decision it should inform, the development outcomes that the decision contributes to and the indicators that measure their achievement (see factsheets “Logical Framework Approach” and “Using Indicators to Measure Progress and Performance”). This is particularly relevant for investment decisions. Depending on the decision, the decision-makers can range from public officials over NGO staff to donor agencies (see “Overview of decision-makers and data use in WASH”). They need to be prioritized according to their influence and involvement in the decision-making and in achieving the development outcomes. The tool “AGUASAN wheel” allows identifying the stakeholders that have a high influence on a particular decision, but are not or only somehow involved in the decision-making process. This identification of key decision-makers is particularly important when influencing reluctant decision-makers to incorporate data into their decision-making and in emergency settings where a multitude of stakeholders typically take WASH infrastructure investment decisions simultaneously. Understanding these decision-makers and their information needs, motivation and capacities to take O&M and investment decisions is key in this step (see also factsheet “Human centred design”). Once the decision-makers’ needs have been understood, the next step is to identify which data is necessary for them to identify and solve a problem, answer a question or monitor a process and how they will use it (Source: OPEN DATA WATCH & DATA2X, n.y.). The sustainability of the process and the transparent coordination of the involved stakeholders like government, private sector, NGOs, media and academia equally has to be considered at this point. Particularly the establishment of feedback loops between the users and producers of data as well as the reconciling of local — often project-based — with national monitoring processes is key from an early stage on (see also “Joint Sector Reviews”). Therefore, getting buy-in from key stakeholders like government and allocating clear roles and responsibilities to managing the process (that is steps 2 to 7) will be key in assuring its effectivity and sustainability. Employing professional facilitators and conflict managers to facilitate this set-up of institutional structures and processes is recommended.
Step 2: Collect - Partner with producers of data, harness new data sources and data collection methods, enable database management and train relevant stakeholders.
Some data might already be available, so it will be important to partner with producers of existing data (i.e. national census data), and scan and prioritize other innovative data sources (crowd-sourcing, opportunistic sensing, remote sensing etc.) to then integrate it with the collected data. Key in this phase is not only harnessing new data sources and data collection methods, but also to avoid data overload. Only collect the data that is needed to inform the decisions identified in step 1 is to be collected; “data is only as valuable as the decision it enables” (Florian Teichert, workshop participant). Representative sampling is cheaper and allows capturing data from a representative group to generalize insights and can be done with various collection methods (see overview of data collection methods). Next to the quantity of data, the characteristics of the data are key to their usefulness. Digitization and technological advances have created a boom in new and innovative ways of collecting data. Collection tools like sensor-enabled devices, drones, smartphone apps and accompanying approaches like citizen-science (see ‘Important weblinks’ below for a selection of tools and expert companies) need to be compatible with the defined data type and its requirements. Decisions here will affect the quality and usability of data over their whole life-cycle (Source: OPEN DATA WATCH & DATA2X, n.y.). In disaster response for example the timeliness of data is more important than other data standards. Household surveys that use different indicators are not comparable; neither is geospatial data that uses different geographical definitions. Data entry forms thus need to be standardized to allow for interoperability of data. The appropriate level of disaggregation of data allows for distinguishing the particular needs of certain groups (like women) and for them to be reflected in investment and O&M decisions. Finally, adequately recording, classifying and storing the data in formats that allow further use (Source: OPEN DATA WATCH & DATA2X, n.y.) as well as training database managers is key. Simple data management tools like excel spreadsheets are more user-friendly and thus better adapted in most development contexts; particularly if no access to internet or mobile devices is available (“Keep technology simple, making it more high-tech wouldn’t make it more successful” David Schaub-Jones, workshop participant). Piloting the collection process allows testing and improving the process before it is rolled out on a large scale.
| Examples: SeeTell was invented by SeeSaw and implemented in Angola as a monitoring system to know when repairs or new infrastructure were needed at urban water points in Luanda and Huambo. Vendors and members of Water User Associations use basic cellphones to make 'missed calls' to signal the status of water (none, intermittent, or normal) and the number of hours of water at kiosks and rural water points, as well as report any problems or need for repairs. After reporting via SeeTell, users receive an SMS confirming that their report is being processed (Feedback Loop). In addition, reporters receive morning and evening SMS and 'missed call' reminders, prompting them to report. Local NGO staff are automatically alerted (via email and/or SMS) to reports that each staff member individually selects to receive. All information is accessible online via a dashboard and adjoining map. In addition, the NGO receives comprehensive weekly and monthly reports customised to the monitoring system, by SeeSaw staff. The system does not only allow real-time and customised information on the operational status of each water point, but is also user-friendly and free of charge for users. In addition, frequent reporters are tracked and entered into a lottery with the chance of winning airtime. The collection of data is done with simple mobile phones, instructions are graphical to allow illiterate users to report non-functional water points, and the data dashboards are done with simple excel spreadsheets to allow for operation by non-experts. In just 4 years, the system counted 320’000 incoming reports by 450 reporters and benefitted 200’000 beneficiaries. The Integrated e-Diagnostic Approach (IeDA) was developed and implemented by Terre des hommes in remote health care centres in Burkina Faso. The mobile application on digital tablets improves children’s medical treatment thanks to a better diagnosis. Data is stored and processed for analyses, reporting and quality control improvements. As a result, diagnosis has improved and treatment is more adapted to the children’s medical needs. In addition, it is an important source of first-hand information for the national vital statistics. Real-time data collection provides valuable and essential information to monitor early warning for epidemic outbreaks. E-learning “is another advantage of this product: it includes coaching and supervision systems, and enables us to improve health care workers training, making them more efficient at diagnosing and treating patients,” says Thierry Agagliate, project co-founder. Health workers are given a tablet, which guides them through a question catalogue based on the WHO clinical protocol (IMCI) to make a correct diagnosis and prescribe the right treatment. Health workers can find example videos in the app that help them identify certain danger signs like high-pitched coughing. Since 2014, 1.5 million children have been consulted with the IeDA and the quality of diagnosis has improved by 50%. |
Publication
The second stage of the process is publication. Once collected, data must be processed, analysed and published in such a way that data users can access it. The publication stage also involves the validation of the data before it can be released in online and offline formats and actively disseminated to data users.
Step 3: Process & analyse - Ensure high quality and that data privacy standards are applied to data processing. Extract insights from data by applying indicators/calculations and visualize data in clear manner.
Before processing and analysing the data to extract useful information (Source: OPEN DATA WATCH & DATA2X, n.y.), it needs to be validated — its quality and data sources need to be verified. Although phenomena like fake news, manipulated data and ‘Zombie statistics’ are not new phenomena, the uncontrolled spread of this kind of information has exploded with social media. It is thus essential to be able to trace the sources of data and make the processing of data transparent to create trust in the data and ultimately increase its value (Source: OPEN DATA WATCH & DATA2X, n.y.).
Next to data reliability, data producers need to keep in mind privacy standards. In light of the massive amounts of data being passively generated (‘digital footprint’) from sensor-enabled devices or inferred via algorithms (‘big data’) the issue of data privacy and the protection from data-related discrimination is pivotal (Source: IEAG 2014, 2014). Particularly sensitive information such as hygiene behaviour needs to be anonymised before it is released (see also “UN Basic Principles for the Data Revolution for Sustainable Development”).
Although tools for processing and visualizing data are abundant, professional expertise — particularly statistical know-how — is key in extracting useful insights from the data that address the indicators identified in step 1. GIS mapping and other analytical tools (such as the “Gapminder Tools”) allow producers to give data context and meaning by visualising relationships and patterns. To be able to extract insights from data not only statistical know-how is required but also knowledge from various disciplines. For example, to gain more accurate insights into a particular WRM situation and come up with water sources development plans, it is necessary to analyse groundwater levels, climate forecasts, population and economic growth projections amongst others and interrelate them. Training is thus not only required for collecting the data, but also for reading it (‘data literacy’) and translating it into information without misinterpreting it (by using adequate analytical tools and processes). Bringing in external expertise from data analysts (for example through data dives) are inevitable for most organisations in retrieving insights from data and being able to answer a question or solve a problem.
Finally, the audience of the information needs to be kept in mind when extracting insights from data. The KISS-principle “Keep it simple, stupid” applies particularly when extracting insights from data for policy making and advocacy — that is for non-experts. Editing and compiling aggregates, creating tables and visualizations, and disseminating the results with the end user in mind are critical activities on the road to creating impact (Source: OPEN DATA WATCH & DATA2X n.y.).
Step 4: Release & disseminate - Make data accessible online and offline, develop appropriate communication channels to ensure good cooperation with intermediaries and publicize data availability.
Releasing and disseminating the information entails two aspects. Choosing the right formats for publishing the information as well as choosing the right channels for disseminating this information to the right users or intermediaries. The KISS-principle also applies when choosing the formats to ensure easy readability of data. The communication of data needs to be tailored to the target audience in terms of content and design and it needs to be actionable information — that is directly linked to the O&M and investment decisions at stake. Using existing formats (offline like flyers or public town meetings; online like data dashboards, example: Water Dashboard of Cape Town) and dissemination channels of data users (i.e. existing platforms, websites) or co-creating dissemination channels and communication structures between data producers and data users increases the chances of uptake. The release of data also needs to be timed with decision-making cycles.
Certain data — particularly on public spending and resources — has to be free of charge and open by default so that all stakeholders can take decisions and citizens can hold governments accountable for their decisions.
| Examples: The start-up Gather trains young people to map sanitation in the areas where they live, dive into the sector’s existing data to understand the gaps and suggest adoptable changes to make data more shareable and usable and is building an online platform to visualise priority areas for investment. In a 2018 data dive they gathered international data analysts to gain insight into existing practices of an influential sanitation provider and from this experience create a data standard that is robust, field-tested and provides an incentive for organisations to apply it. They used a dataset from an urban sanitation organisation looking to identify market opportunities in Kanyama, Zambia. It was a census type dataset that surveyed each plot/household within a defined area and a coverage of a population larger than 100,000 people. Data was available for a wide range of variables, including the type and state of toilet facilities, but also current faecal sludge management practices. During the dive, the analysts focused on four areas of investigation: 1) Validity: to understand the validity and usefulness of the data. 2) Risk: to understand Kanyama’s vulnerability in times of public health crisis. 3) Demographics: to understand how the data set could be curated with geospatial information. 4) Pit emptying: to understand how pit emptying routes can be optimised. Although the data set did not meet general data standards (like availability of codebooks, file readability, data format etc.) the analysts concluded that large-scale, one-off surveys produce are useful for descriptive analysis to gain a basic understanding of the state of sanitation in an area. However, they also concluded that they are not as useful for prescriptive analysis for what could and should be done to improve sanitation in an area. Dollar Street was invented by Anna Rosling Rönnlund at Gapminder. For 15 years she spent her workdays making global public data easier to understand and use. Over time her frustration grew: carefully selecting data to present it in colorful and moving charts made overall global trends and patterns easier to understand. But it did not make everyday life on different income levels understandable. Especially not in places far from home. “People in other cultures are often portrayed as scary or exotic.” Anna explains: “This has to change. We want to show how people really live. It seemed natural to use photos as data so people can see for themselves what life looks like on different income levels. Dollar Street lets you visit many, many homes all over the world. Without travelling.”. Next to photos of their toilets, drinking water sources, hand-washing facilities and more, people with different income levels were also asked to show things they dream of having (only one household dreaming of sanitary facilities). |
Uptake
The release and dissemination of data is essential but not sufficient for decision-makers to incorporate it in their O&M and investment decisions; particularly in contexts where evidence-based decision-making is not the norm and data flows are not established. The uptake stage thus involves actively connecting to decision-makers as well as incentivizing and influencing them to incorporate data into their decision-making.
Step 5: Connect & incentivise - Connect to data users and train them in efficiently using and sharing the data.
Actively connecting to decision-makers by organizing face-to-face meetings and training them to use information technology tools and data in their decision-making is needed to ensure uptake. In this process of reaching out to decision-makers, it is not only important to capacitate them by carrying out trainings and reduce time-cost of data use, but also to connect to them in an empathetic way and understand what drives them as individuals to use the adequate data to take decisions. Designing value propositions for the decision-makers (see factsheet “Identifying the value proposition”) by pinpointing the individual benefits that using data can offer them is key to incentivizing them. They need to see the value of data and how incorporating it in their decision-making will satisfy their needs or alleviate the pains they face as local municipal officers, utility managers, farmers or water committee representatives. For this purpose, the first step of identifying decision-makers and understanding their motivations and needs is of utmost importance (see step 1). Furthermore, building a brand around the data will increase its perception as trust-worthy and of high-quality. Possible ways to incentivize them and increase uptake of data are rewards like performance-based promotion schemes, awards for evidence-based action, work-related trainings. Developing a gamification strategy, so applying the essence of games like fun, play, design and challenge to data use can be helpful in increasing uptake (see “The Power of Games: How to Generate a Successful Gamification Strategy”).
Step 6: Influence - Liaise with civil society and advocacy groups to promote data use for decisions and to increase accountability.
The overall societal value of using data in decision-making can be shown by making the costs of inaction tangible and creating narratives both around success stories at a national scale (socio-economic benefits around sanitation; for example in a policy brief) as well as giving visibility to the individual success stories of data use champions (see factsheet “Storytelling”). Defining allies within the decision-making unit and exploiting synergies to drive evidence-based decision-making is another option. Next to relevance and quality, trust in data and perceptions of autonomy or lack of political interference will highly affect uptake of data (Source: OPEN DATA WATCH & DATA2X, n.y.).
If cooperative approaches like incentivizing decision-makers to use data do not work, confrontative approaches can be taken to influence them. For this purpose civil society and advocacy groups need to be engaged and empowered to exert pressure and hold their decision-makers accountable. Traditional and social media also play an important role in increasing transparency around data and in making the lack of data-based decisions public (see also SSWM perspective “Water Reporting and Journalism”).
| Example: The Gender Statistics Toolkit designed by United Nations System Staff College (UNSSC) and the African Centre for Statistics of the United Nations Economic Commission for Africa (UNECA) educates statistics users and producers about the development of gender statistics at the country level. The course provides orientation in best practices and issues in planning, gathering, and sharing unbiased gender statistics. This training provides a foundation of knowledge that will reduce barriers to producing high-quality gender statistics and using them as a basis for informed decision-making, policy and program formulation, and monitoring.The toolkit is structured around four modules. The first introduces gender statistics and covers the importance of gender statistics in the African context, key gender terms and indicators, and locating additional educational resources. The second module discusses planning a gender statistics initiative, including the importance of producer-user dialogue, conducting a gender-sensitive needs analysis, and communicating the need for new data collection. The third module discusses producing gender statistics: integrating gender perspectives into the data production process, identifying gender issues and gender-biased language in surveys, and how to provide feedback to on bringing a gender perspective into statistical activities in the offices of course participants. The fourth module discusses communicating and using gender statistics as a tool for change, including ways to disseminate gender statistics, prepare reader-friendly gender data tables, choose data visualizations, and make policy recommendations based on gender-data analysis (Source: OPEN DATA WATCH & DATA2X, n.y.). |
Impact
The impact stage involves using the data to understand a problem or make a decision, acting on it and adapting the data-based decision-making process.
Step 7: Use & adapt - Support users in using the data to make investment and O&M decisions, track data-driven-investment and O&M decisions and document initial user feedback on data, and adapt the process accordingly.
The last step is about supporting users in applying the insights from data to take decisions that lead to the intended outcomes defined in step 1 like changing the outcome of a process or improving a condition and ultimately someone’s wellbeing.
Investment decisions are typically made by governments, service providers, development partners and ideally water committees. For evidence-based decision-making, these stakeholders need information from socio-economic data, data on population density, location and state of water resources, state of infrastructure and available technologies — amongst others. For example, by mapping water sources, households and the distance between them, strategic decisions can be made on priority areas for infrastructure upgrades.
Operators need information to take informed O&M decisions regarding water treatment, water allocation and the repair of broken parts. Failure of accurate and timely reporting of data on pipe leaks for example can result in even greater infrastructure deterioration, high costs and reduced service provision. Pumps that digitally track all water point interventions allow to keep installed water points in operation adding to the effectiveness and efficiency of initial investments.
In this step, it will be important to track if the data-based decisions lead to the intended outcomes (see factsheet “Using Indicators to Measure Progress and Performance”) and communicate the successes to reemphasize the importance of data-based decision-making and increase trust in the process among stakeholders. Users and the general public should see clear positive changes as a result of using the data to encourage support for data production (like citizens collecting the data) (Source: OPEN DATA WATCH & DATA2X, n.y.).
In this step it is also important to capitalise on the experiences made managing the process and documenting the lessons learnt (see also “After Action Review”) to adapt the process if necessary. The feedback loops set up in step 1 need to be reinforced and the process needs to be institutionalised for continued engagement and scale-up and scale-out.
| Example: The regional programme of the UNICEF Western and Central Africa Regional Office (WCARO) aims to accelerate national and subnational WASH monitoring for the improved management and delivery of water and sanitation services in nine West and Central African countries. The Akvo Foundation has developed a number of tools and approaches to support the programme in capturing, cleaning, visualising and sharing data on WASH infrastructure. The programme achieved to produce SDG and operational pilot data on WASH services and infrastructure in the nine implementing countries, to strengthen governmental officials’ capacities on data collection, data visualisation, data analysis, and water quality testing. While the journey to establishing national monitoring systems is long and complex, significant steps have already been taken. With the field data collection, the availability of data on WASH infrastructure at national level has increased significantly, and some countries are sharing their data openly on the international Water Point Data Exchange (WDPx) platform. In addition, case studies, posters and videos were produced for these countries that document not only the insights from the collected data but also the process and lessons learnt from the development of national monitoring systems. |
Leveraging the data revolution
Results from the 34th AGUASAN Workshop, Bern.
A world that counts
The data value chain – Moving from Production to Impact
Joint Sector Reviews for Water, Sanitation an Hygiene (WASH)
Monitoring & Data for Rural Water Supplies: Different Perspectives. Common Goals
A world that counts
Decoding Data Use: How do leaders source data and use it to accelerate development?
The Power of Games: How to Generate a Successful Gamification Strategy
Unlocking the Potential of Information Communications Technology to Improve Water and Sanitation Services
The data value chain – Moving from Production to Impact
Value proposition design: how to create products and services customers want
The book Value Proposition Design helps tackle the core challenge of every business - creating compelling products and services customers want to buy. This highly practical book, paired with its online companion, will teach you the processes and tools you need to design, test, create, and manage products and services customers actually want.
OSTERWALDER, A. et al. (2014): Value proposition design: how to create products and services customers want. John Wiley & Sons URL [Accessed: 09.11.2018]AGUASAN
SeeSaw
SeeSaw helps those that provide clean water, protect the environment, deliver sanitation, adapt to climate change etc, by assisting them to harness the benefits of ICT. We do this by providing training, consulting and customised ICT tools and systems.
Akvo Foundation
hydrosolutions Ltd.
Gather
Gather brings people and data together to solve the urban sanitation crisis
http://gatherhub.org/ [Accessed: 09.11.2018]WASHwatch
WASHwatch provides data and information on policies and policy commitments, coordination and reporting mechanisms by countries as well as information on water sector donors.
WPDx
gapminder
AidData
AidData is a research lab at William & Mary's Global Research Institute. We equip policymakers and practitioners with better evidence to improve how sustainable development investments are targeted, monitored, and evaluated. We use rigorous methods, cutting-edge tools, and granular data to answer the question: who is doing what, where, for whom, and to what effect?
https://www.aiddata.org/ [Accessed: 09.11.2018]Calling Bullshit
The world is awash in bullshit which involves language, statistical figures, data graphics, and other forms of presentation intended to persuade by impressing and overwhelming a reader or listener, with a blatant disregard for truth and logical coherence. This website aims at teaching you how to think critically about the data and models that constitute evidence in the social and natural sciences.