Introduction
The water footprint of a product is an empirical indicator of how much water is consumed, when and where, measured over the whole supply chain of the product (see also using indicators to measure progress and performance). Thus, the water footprint is a multidimensional indicator, showing volumes but also making explicit the type of water use (evaporation of rainwater, surface water or groundwater, or water pollution) and the location and timing of water use.
The water footprint can be one indicator in the life cycle assessment (LCA) of a product next to other indicators such as carbon emitted.
Water is known to be a renewable resource as it is cycling through the environment (see water cycle). So, why do we bother making a water footprint? For almost all human purposes such as drinking, irrigation, energyproduction, transportation, cooking, washing, etc. freshwater is needed. Salt water, which dominates the earth’s surface and the available water resources, cannot be used for these purposes (see also the water cycle or introduction to water sources). Even though freshwater is a renewable resource, it is not unlimited and counts for only about 3% of the earth’s water resources. Most of these 3% are not directly accessible; water in lakes and river accounts for less than 0,01% of global water resources.In a certain period, precipitation is always limited to a certain amount and water can get scarce. The same holds true for the amount of water that recharges groundwater reserves and that flows through a river. In these periods, one cannot use more water than the amount that is being recharged into the water body (see also water balance estimation, water resources assessment, or water allocation). As humankind is strongly dependent on freshwater, making a water footprint can help identifying products that can be risky to produce at a certain location and at a certain period of time.The water footprint of humanity has exceeded sustainable levels at several places and is unequally distributed among people. A water footprint canhelp achieve a more sustainable and equitable use of fresh water. More possibilities to optimise water use can be found in the section on water use for households, industry and agriculture.
Applications of Water Footprints
As already mentioned, the concept of water footprint cannot only be used for products (as is the case with virtual water) but can also be applied to persons, businesses, communities, nations, geographically delineated areas and for humanity in total.
Possible applications are:
- Process step: the water footprint of a single process step is the basic building block for all water footprint counts.
- Product: is the aggregate of the water footprints of all the process steps needed to produce an intermediate or final product.
- Person/consumer: the sum of all the water footprints of the products that are consumed by that person.
- Community: sum of the water footprints of the products consumed by all consumers that are part of the community.
- Producer/business: sum of the water footprints of the products that the producer/business delivers.
- Geographically delineated area: sum of water footprints of all processes taking place in that area.
- Nation: the sum of the water footprints of all activities within a nation (all fresh water that is used to produce the goods and services consumed by the inhabitants of the nation). This is both internal as external water use.
- Humanity: the total water footprint of humanity is equal to the sum of water footprints of all consumers and thus of all final consumer goods and services consumed annually and also equal to the sum of all water-consuming and polluting processes in the world.
Depending on the application, different units are calculated with a water footprint:
Scope | Units |
Process step | Volume per unit of time |
Product | Volume per unit of product (e.g. unit of mass, money, energy, per piece) |
Person/consumer | Volume per unit of time per capita |
Producer/business | Volume per unit of time / volume per unit of time divided by turnover |
Geographically delineated area | Volume per unit of time |
Nation | Volume per unit of time per capita |
Components of Water Footprints
Various standards for water footprints exist. Probably the most well-known standard is the Global Water Footprint Standard developed by the Water Footprint Network (WFN). The International Organization for Standardization (ISO) is currently working on a procedural standard on how to incorporate water footprint in a product Life Cycle Analysis (LCA). This ISO standard will be linked to the Global Water Footprint Standard. While the ISO 14046 is still a draft and expected to become a standard in 2014, the WULCA working group (a group of researchers from North America, Europe and Australia) is currently working on a methodology for this standard. Find more information on the methodology on the group’s website.
The Global Water Footprint Standard accounts for:
- Direct (for a consumer: the water that is directly consumed e.g. for drinking and washing) and indirect (the water that is needed for the production of products a consumer consumes) water use
- Water consumption and water pollution
- Next to the blue water footprint also the green and grey water footprint
- The total water footprint is the sum of blue, green and grey water consumption.
Blue Water Footprint
The blue water footprint is the consumption of fresh invalid link or groundwater and is taking into account:
- Water that evaporates and transpires
- Water incorporated into the product
- Water that does not return to the same catchment area (but might be returned to the sea or another catchment area)
- Water that does not return in the same period (might be withdrawn in a dry period and returned in a wet period)
Evapotranspiration generally takes up the most significant part of the blue water footprint.
Green Water Footprint
The green water footprint is the consumption of water that refers to precipitation on land that does not run off or recharge the groundwater but is stored in the soil or temporarily stays on top of the soil or vegetation. Green water is usually used for crop growth. The green footprint includes:
- Water that evaporates and transpires from fields and plantations
- Water incorporated into the harvested crop or wood
Grey Water Footprint
The grey water footprint is an indicator of the degree offreshwater pollution that can be associated with a process step or a product or consumer, etc.It is the volume of freshwater that is required to assimilate the load of pollutantsbased on natural background concentrations and existing ambient water qualitystandards.
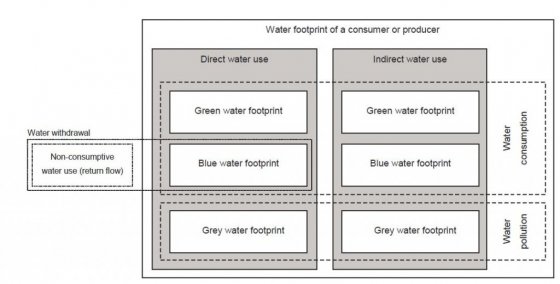
Components of a water footprint. The non-consumptive part of water withdrawals (return flow) is not part of the water footprint. Source: HOEKSTRA et al. (2011)
Virtual Water
In terms of the water used to make a product, the water footprint can also be referred to as the product’s virtual water content. Virtual water is the total amount of water, which has been used to produce a good as well as the water indirectly used (e.g. the water required to produce the feed for an animal when calculating the water footprint of the animal’s meat). It is called virtual because the final good no longer contains the amount of total water, which was used to produce it. The two differences between virtual water and a water footprint are that:
- Virtual water only refers to the water content whereas the water footprint is a multi-dimensional indicator. Next to the volume it also identifies where the water footprint is located, what water source is used and when the water is used. The additional information is crucial in order to assess the impacts of the water footprint of a product. Also, the water footprint concept has a wider application.
- Whereas virtual water can only be calculated for a product, a water footprint can additionally be calculated for a consumer, by looking at the water footprints of the goods and services consumed, or of a producer (business, manufacturer, service provider) by looking at the water footprint of the goods and services produced by the producer. It can also be calculated for a community, area, nation or humanity.
Examples of Water Footprint
Products
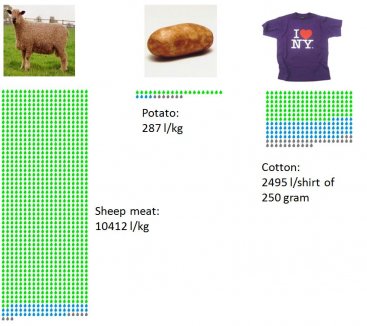
Comparison of product global water footprints and the share of green, blue and grey water. Source: http://www.waterfootprint.org
Comparing agricultural products, animal products generally have a larger water footprint than crop products both for litres per ton as well as per calorie. The average water footprint per calorie for beef is twenty times larger than for cereals or starchy roots. This large difference is due to various factors. Firstly, animals need more time to grow and then they need to be fed: 98% of the water footprint of animals refers to the feed for the animals (HOEKSTRA 2012).
From a freshwater resource perspective, it is more efficient to obtain calories, protein and fat through crop products than animal products.
National Water Footprint
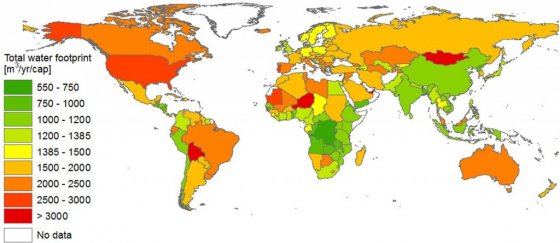
National total water footprint of consumption (1996-2005).Source: MEKONNEN & HOEKSTRA (2011)
Traditionally, national water plans are made in order to plan the provision of sufficient water to all water users. Yet, this national view neglects the “imported water” that is attached to a product that was produced outside of the country. Externalising a nation’s water footprint by importing a lot of “water-intensive” products threatens the sustainability of a national consumption, as they might be attached to depletion and pollution of the producing country. Also, this might increase the dependency on foreign freshwater resources.
Consumption of agricultural products largely determines the global water footprint related to consumption, contributing 92% to the total water footprint. Consumption of industrial products and domestic water use contribute 4.7% and 3.8% respectively.
The total water footprint per year per capita varies, among others, by differences in consumption patterns: countries with high consumption of bovine meat – one of the highly water-intensive commodities – usually also have a higher national water footprint. It can also vary due to the water consumption and pollution per unit of product per country, e.g. in the USA, the average water footprint of one kg of consumed bovine meat is 14500 m3/ton, while in the UK this is 9900 m3/ton (MEKONNEN & HOEKSTRA 2011).
Are We Sustainable? - Assessing the Water Footprint
The Water Footprint itself provides us with mere facts on the quantity, location, time and kind of water source.
Yet, the important information we want to retrieve from calculating the Water Footprint is to find out whether the impact of the Water Footprint is sustainable! This is done with the help of the Water Footprint Sustainability Assessment.
A Water Footprint Assessment is conducted as follows:
- Water Footprint Accounting (= calculating quantity, location, time and water source)
- Water Footprint Sustainability Assessment (environmental, social, economic)
- Water Footprint Response Formulation
The severity of the environmental impact of water consumption and pollution can be assessed by comparing the water footprint of a product/person/nation etc. with the availability of water in the affected water bodies at the location and time of withdrawal. Water Risk Maps can be used as a basis for comparison. Find a selection of Water Risk Maps under Weblinks below. It is also informative to assess whether a certain product/person/nation etc. contributes to specific hotspots of water scarcity or pollution, but also whether it contributes unnecessarily to the global water footprint of humanity.
A Water Footprint Sustainability Assessment does not only assess the environmental impact of a product/person/nation etc. but also the social and economic impact. By assessing the impact, response strategies can be formulated to directly target activities that lead to water scarcity and pollution.This way, water footprint assessment can be used to improve water source protection and sustainability of water use.
The Water Footprint Assessment Manual. Setting the Global Standard
This book contains the global standard for ‘water footprint assessment’ as developed and maintained by the Water Footprint Network (WFN). It covers a comprehensive set of definitions and methods for water footprint accounting. It shows how water footprints are calculated for individual processes and products, as well as for consumers, nations and businesses. It also includes methods for water footprint sustainability assessment and a library of water footprint response options.
HOEKSTRA, A.Y. CHAPAGAIN, A.K. ALDAYA, M.M. MEKONNEN, M.M. (2011): The Water Footprint Assessment Manual. Setting the Global Standard. London/Washington: Earthscan URL [Accessed: 03.09.2013]National Water Footprint Accounts. The Green, Blue and Grey Water Footprint of Production and Consumption
This study quantifies and maps the water footprints of nations from both a production and consumption perspective and estimates international virtual water flows and national and global water savings as a result of trade. The entire estimate includes a breakdown of water footprints, virtual water flows and water savings into their green, blue and grey components.
MEKONNEN, M.M. HOEKSTRA, A.Y. (2011): National Water Footprint Accounts. The Green, Blue and Grey Water Footprint of Production and Consumption. (= Value of Water Research Report Series , 50 ). Delft: United Nations Educational, Scientific and Cultural Organization-Institute for Water Education (UNESCO-IHE) URL [Accessed: 03.09.2013]Water Footprint
The Hidden Water Resource Use Behind Meat and Dairy
This paper reviews recent research carried out regarding the hidden water resource use behind meat and dairy production. First, the water footprint concept is introduced, an indicator increasingly used worldwide to assess the water resource implications of consumption and trade. Second, results from recent research are summarized, indicating that for assessing the water footprint of meat and dairy, it is most relevant to carefully consider both the feed conversion effi ciency when raising animals and the feed composition. Third, the water footprint of animal products is compared with the water footprint of crops. Next, the water footprint of a meat-based diet is compared with the water footprint of a vegetarian diet. It is then shown that understanding the relationship between food consumption and the use of freshwater resources is no longer just a local issue.
HOEKSTRA, A.Y. (2012): The Hidden Water Resource Use Behind Meat and Dairy. In: Animal Frontiers: Volume 2 , 3-8. URL [Accessed: 03.09.2013]Water Footprints of Nations - Volume 1: Main Report
The study tries to analyse and to collect the water footprints of nations. The water footprint of a nation consist of the total amount of used domestic water resources plus the virtual water flows entering the country minus the flows leaving the country.
CHAPAGAIN, A. K. HOEKSTRA, A.Y. (2004): Water Footprints of Nations - Volume 1: Main Report. (= Research Report Series No. 16 , 1 ). Delft: UNESCO-IHE, Institute for Water Education URL [Accessed: 12.10.2010]A Global and High-resolution Assessment of the Green, Blue and Grey Water Footprint of Wheat
A paper which deals with the virtual water content of wheat. The assessment is made on a global level and includes the exploring of green, blue and grey water used during wheat production.
MEKONNEN, M.M. ; HOEKSTRA, A.Y. (2010): A Global and High-resolution Assessment of the Green, Blue and Grey Water Footprint of Wheat. In: Hydrology and Earth System Sciences: Volume 14 , 1259-1276. URL [Accessed: 12.10.2010]Switzerland’s Water Footprint
Water for Business. Initiatives guiding sustainable water management in the private sector
The future of any business depends on the sustainability of water resources, which are increasingly under pressure. At the same time, consumer awareness and investors' increased scrutiny of corporate water risks have resulted in stronger expectations that companies should reveal their ‘water performance'. To respond effectively, the business community needs guidance, tools, standards and schemes to enable change to more sustainable practices. This is what this publication aims at providing.
WBCSD (2009): Water for Business. Initiatives guiding sustainable water management in the private sector. Geneva: WBDSC and IUCN URL [Accessed: 06.05.2019]A Global Assessment of the Water Footprint of Farm Animal Products
This paper provides a comprehensive account of the water footprint of animal products, considering different production systems and feed composition per animal type and country.
MEKONNEN, M.M. ; HOEKSTRA, A.Y. (2012): A Global Assessment of the Water Footprint of Farm Animal Products. In: Ecosystems: Volume 15 , 401-415. URL [Accessed: 04.09.2013]The Green, Blue and Grey Water Footprint of Crops and Derived Crop Products
This study quantifies the green, blue and grey water footprint of global crop production in a spatially-explicit way for the period 1996–2005.
MEKONNEN, M.M. ; HOEKSTRA, A.Y. (2011): The Green, Blue and Grey Water Footprint of Crops and Derived Crop Products. In: Hydrology and Earth System Sciences: Volume 15 , 1577-1600. URL [Accessed: 09.09.2013]A Comprehensive Introduction to Water Footprints
This presentation provides a short introduction to the concept of water footprinting.
HOEKSTRA, A. Y. (2011): A Comprehensive Introduction to Water Footprints. Enschede: Water Footprint Network URL [Accessed: 09.09.2013]Water Footprint. Virtual Water Embedded in Products
This poster visualises the water footprint of twelve selected commodities.
KEKERITZ, T. (2010): Water Footprint. Virtual Water Embedded in Products. Enschede: Water Footprint Network (WFN) URL [Accessed: 09.09.2013]Water Footprint of Daily Life
The poster shows the water footprint of daily life and options for reduction.
GOOD INFOGRAPHICS (2009): Water Footprint of Daily Life. Los Angeles: Good Infographics URL [Accessed: 09.09.2013]http://www.waterfootprint.org/
The Water Footprint Network provides explanations, publications, case studies and its own framework for waterfootprinting. You can also find the free Water Footprint Assessment Tool online.
http://www.wulca-waterlca.org/
This is the website of the WULCA working group. This group works as an international working group focusing on water use assessment and water footprinting taking the life cycle perspective. The WULCA working group’s overall goal focuses on providing practitioners, from both industry and academia, with a coherent framework within which to measure, assess and compare the environmental performance of products and operations regarding freshwater use.
http://waterriskfilter.panda.org/
This tool allows quantifying water-related risks for all industries in all countries.
http://aqueduct.wri.org/
This tool by the World Resources Institute measures and maps water risks around the globe.
http://www.wbcsd.org/
This tool by the World Business Council for Sustainable Development (WBCSD) is designed for companies and organisations to map their water use and assess risks relative to their global operations and supply chains.